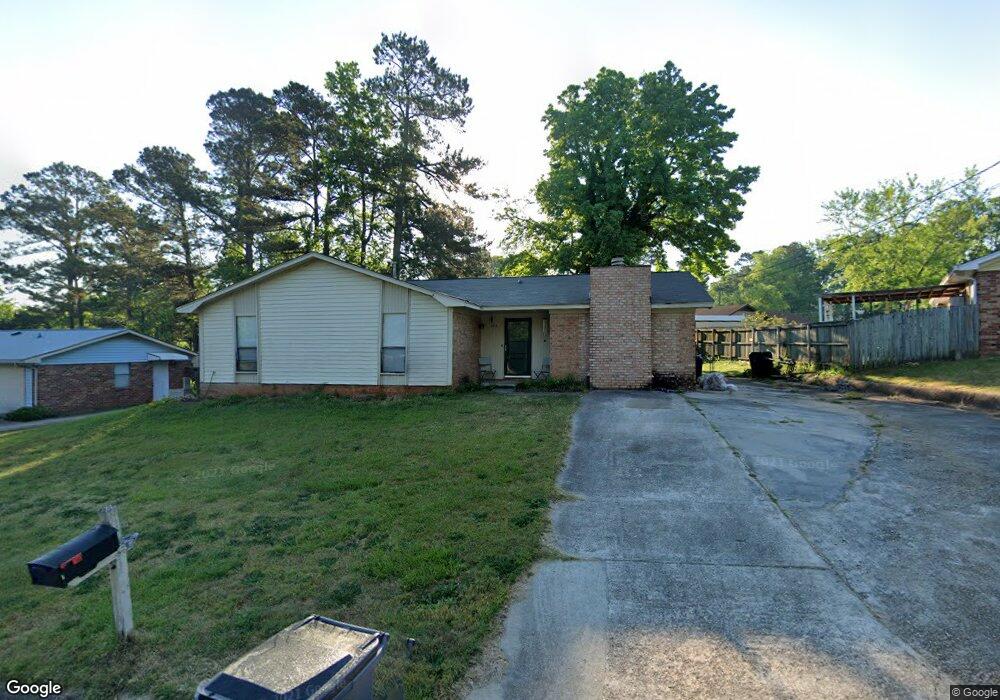
143 W Lynne Dr Augusta, GA 30907
Estimated Value: $229,272 - $253,000
3
Beds
2
Baths
1,600
Sq Ft
$153/Sq Ft
Est. Value
About This Home
This home is located at 143 W Lynne Dr, Augusta, GA 30907 and is currently estimated at $244,318, approximately $152 per square foot. 143 W Lynne Dr is a home located in Columbia County with nearby schools including Martinez Elementary School, Westmont Elementary School, and Evans Middle School.
Ownership History
Date
Name
Owned For
Owner Type
Purchase Details
Closed on
Apr 29, 2022
Sold by
Irons Terrance A
Bought by
Klockenga Miranda H
Current Estimated Value
Home Financials for this Owner
Home Financials are based on the most recent Mortgage that was taken out on this home.
Original Mortgage
$204,600
Outstanding Balance
$192,002
Interest Rate
4.16%
Mortgage Type
VA
Estimated Equity
$52,316
Purchase Details
Closed on
Mar 27, 2009
Sold by
Powell Jonothan R
Bought by
Irons Terrence A
Home Financials for this Owner
Home Financials are based on the most recent Mortgage that was taken out on this home.
Original Mortgage
$135,399
Interest Rate
5.14%
Mortgage Type
VA
Purchase Details
Closed on
May 16, 2003
Sold by
Hare Joseph J and Hare Kimberly J
Bought by
Powell Jonothan R
Home Financials for this Owner
Home Financials are based on the most recent Mortgage that was taken out on this home.
Original Mortgage
$87,200
Interest Rate
5.79%
Mortgage Type
Purchase Money Mortgage
Create a Home Valuation Report for This Property
The Home Valuation Report is an in-depth analysis detailing your home's value as well as a comparison with similar homes in the area
Home Values in the Area
Average Home Value in this Area
Purchase History
| Date | Buyer | Sale Price | Title Company |
|---|---|---|---|
| Klockenga Miranda H | $200,000 | -- | |
| Irons Terrence A | $132,600 | -- | |
| Powell Jonothan R | $89,900 | -- |
Source: Public Records
Mortgage History
| Date | Status | Borrower | Loan Amount |
|---|---|---|---|
| Open | Klockenga Miranda H | $204,600 | |
| Previous Owner | Irons Terrence A | $135,399 | |
| Previous Owner | Powell Jonothan R | $87,200 |
Source: Public Records
Tax History Compared to Growth
Tax History
| Year | Tax Paid | Tax Assessment Tax Assessment Total Assessment is a certain percentage of the fair market value that is determined by local assessors to be the total taxable value of land and additions on the property. | Land | Improvement |
|---|---|---|---|---|
| 2025 | $2,299 | $95,888 | $15,604 | $80,284 |
| 2024 | $2,314 | $92,227 | $15,604 | $76,623 |
| 2023 | $2,314 | $80,000 | $15,320 | $64,680 |
| 2022 | $1,730 | $64,328 | $13,004 | $51,324 |
| 2021 | $1,640 | $58,140 | $12,204 | $45,936 |
| 2020 | $1,498 | $51,829 | $10,704 | $41,125 |
| 2019 | $1,369 | $47,166 | $10,204 | $36,962 |
| 2018 | $1,264 | $43,254 | $9,404 | $33,850 |
| 2017 | $1,259 | $42,930 | $9,804 | $33,126 |
| 2016 | $1,159 | $40,784 | $8,980 | $31,804 |
| 2015 | $1,101 | $38,568 | $8,780 | $29,788 |
| 2014 | $1,116 | $38,652 | $8,580 | $30,072 |
Source: Public Records
Map
Nearby Homes
- 155 Ashbyrne Dr
- 226 Ashley Cir
- 114 W Lynne Dr
- 108 Whetstone Ct
- 149 Woodland Dr
- 174 Creek View Ct
- 228 Woodland Dr
- 108 Morehead Dr
- 222 Oakridge Dr
- 4045 Dowling Dr
- 4355 Columbia Rd
- 102 Cokesbury Ct
- 117 Lenox Dr
- 103 Dresden Dr
- 117 Lenox Place
- 4134 Allison Rd
- 4425 Branchwood Dr
- 126 Wood Creek Dr
- 104 Moss Creek Dr
- 4129 Allison Rd
- 145 W Lynne Dr
- 141 W Lynne Dr
- 4241 Waylon Dr
- 144 Shawns Way
- 146 W Lynne Dr
- 144 W Lynne Dr
- 147 W Lynne Dr
- 148 W Lynne Dr
- 146 Shawns Way
- 140 Shawns Way
- 150 W Lynne Dr
- 4239 Waylon Dr
- 145 Ashbyrne Dr
- 147 Ashbyrne Dr
- 149 W Lynne Dr
- 143 Ashbyrne Dr
- 4246 Waylon Dr
- 148 Shawns Way
- 143 Shawns Way
- 141 Ashbyrne Dr