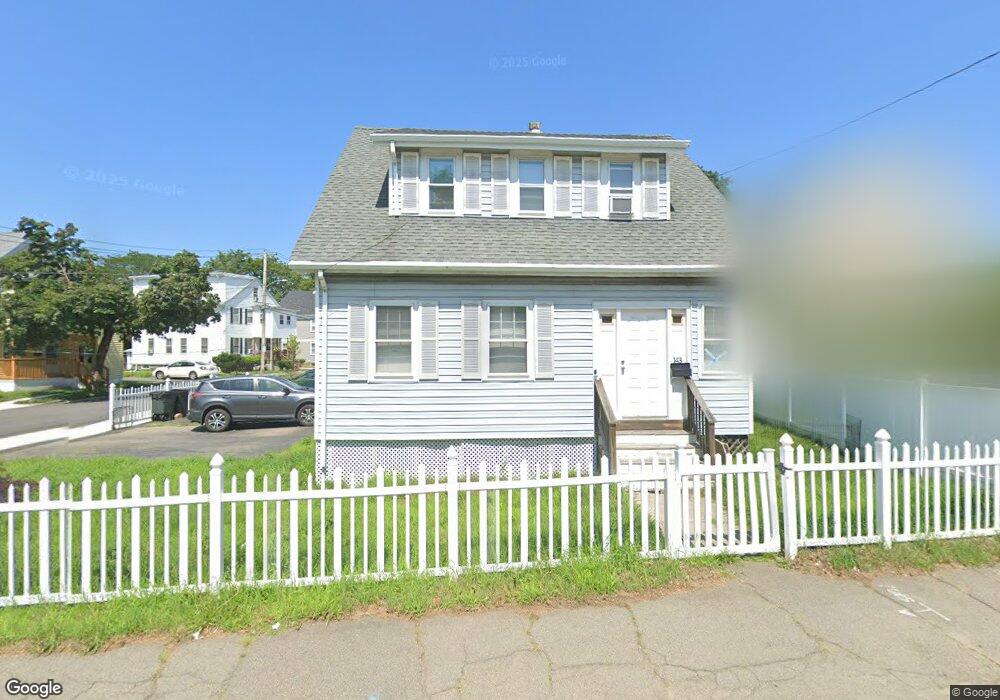
143 W Squantum St Quincy, MA 02171
Montclair NeighborhoodEstimated Value: $697,506 - $780,000
1
Bed
1
Bath
900
Sq Ft
$826/Sq Ft
Est. Value
About This Home
Available September and October move ins! Dates do vary.
Due up front First, Security, and Broker.
Utilities to pay are Electricity, Sewer, and Water.
Walking distance to the North Quincy Red Line, Target and grocery stores we are truly a commuters dream. This 12 story building offers studio, one and two bedroom apartments with balconies and views of both Quincy and the Boston Skyline. Enjoy on site amenities like our fitness center, parking and laundry.
Enjoy everything Quincy has to offer
including great restaurants, beaches and parks. Minutes on
the T and you will find yourself in downtown Boston with even
more to enjoy.
Ownership History
Date
Name
Owned For
Owner Type
Purchase Details
Closed on
Sep 2, 2025
Sold by
Li Ruiqiang and Li Yulan
Bought by
Li Ruiqiang and Li Yuk L
Current Estimated Value
Purchase Details
Closed on
Aug 24, 2011
Sold by
Killilea Irt and Sumner
Bought by
Li Yulan and Li Ruiqiang
Purchase Details
Closed on
Feb 9, 2009
Sold by
Killilea Frances M and Killilea Mark S
Bought by
Killilea Frances M and Sumner Jennifer
Create a Home Valuation Report for This Property
The Home Valuation Report is an in-depth analysis detailing your home's value as well as a comparison with similar homes in the area
Home Values in the Area
Average Home Value in this Area
Purchase History
| Date | Buyer | Sale Price | Title Company |
|---|---|---|---|
| Li Ruiqiang | -- | -- | |
| Li Yulan | $305,000 | -- | |
| Li Yulan | $305,000 | -- | |
| Killilea Frances M | -- | -- | |
| Killilea Frances M | -- | -- |
Source: Public Records
Mortgage History
| Date | Status | Borrower | Loan Amount |
|---|---|---|---|
| Previous Owner | Killilea Frances M | $50,000 | |
| Previous Owner | Killilea Frances M | $50,000 | |
| Previous Owner | Killilea Frances M | $49,900 |
Source: Public Records
Property History
| Date | Event | Price | List to Sale | Price per Sq Ft |
|---|---|---|---|---|
| 11/11/2024 11/11/24 | Off Market | $2,100 | -- | -- |
| 10/08/2024 10/08/24 | Off Market | $2,100 | -- | -- |
| 10/06/2024 10/06/24 | For Rent | $2,100 | 0.0% | -- |
| 10/01/2024 10/01/24 | For Rent | $2,100 | -- | -- |
Tax History Compared to Growth
Tax History
| Year | Tax Paid | Tax Assessment Tax Assessment Total Assessment is a certain percentage of the fair market value that is determined by local assessors to be the total taxable value of land and additions on the property. | Land | Improvement |
|---|---|---|---|---|
| 2025 | $6,645 | $576,300 | $315,000 | $261,300 |
| 2024 | $6,324 | $561,100 | $315,000 | $246,100 |
| 2023 | $5,894 | $529,600 | $300,000 | $229,600 |
| 2022 | $5,740 | $479,100 | $260,900 | $218,200 |
| 2021 | $5,564 | $458,300 | $248,500 | $209,800 |
| 2020 | $5,504 | $442,800 | $248,500 | $194,300 |
| 2019 | $5,056 | $402,900 | $232,200 | $170,700 |
| 2018 | $5,053 | $378,800 | $215,000 | $163,800 |
| 2017 | $4,978 | $351,300 | $204,800 | $146,500 |
| 2016 | $4,624 | $322,000 | $178,100 | $143,900 |
| 2015 | $4,206 | $288,100 | $161,900 | $126,200 |
| 2014 | $3,974 | $267,400 | $154,200 | $113,200 |
Source: Public Records
Map
Nearby Homes
- 115 W Squantum St Unit 810
- 115 W Squantum St Unit 907
- 39 Fayette St Unit 102
- 204 Farrington St
- 143 Arlington St
- 511 Hancock St Unit 207
- 21 Linden St Unit 417
- 85 Myrtle St Unit 105
- 522 Hancock St
- 150 Hancock St Unit 102
- 444 W Squantum St
- 1 Edwin St Unit C
- 94 Newbury Ave Unit 100
- 77 Botolph St
- 43 Ellington Rd
- 260 Elmwood Ave
- 57 Quincy Shore Dr Unit 614
- 57 Quincy Shore Dr Unit PH South
- 276 Belmont St
- 133 Commander Shea Blvd Unit 219