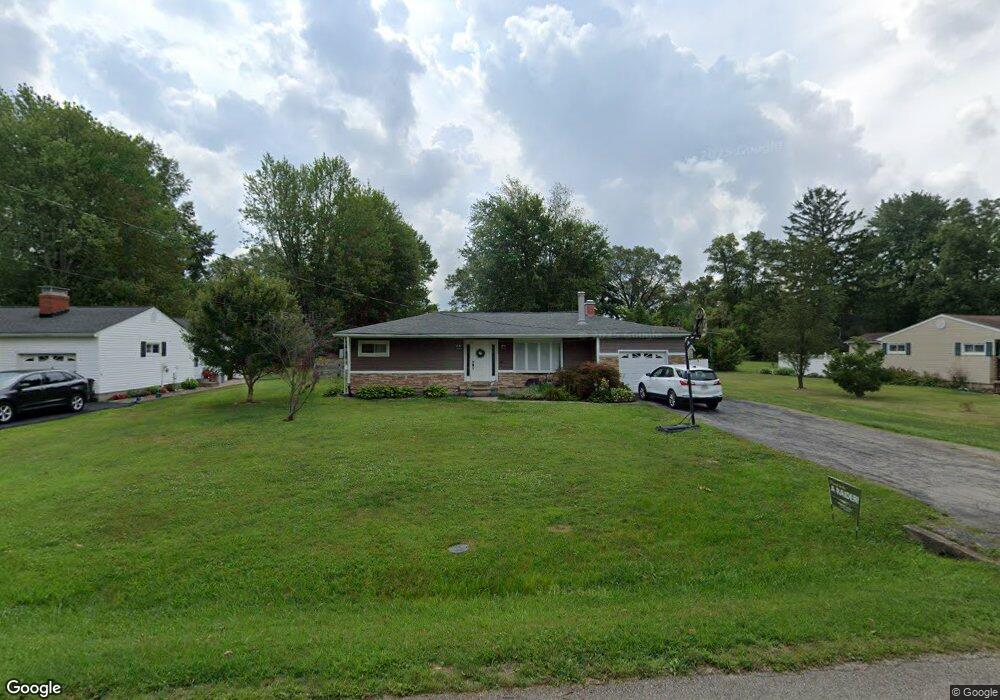
143 Watkins Rd Blanchester, OH 45107
Estimated Value: $220,236 - $310,000
3
Beds
1
Bath
1,616
Sq Ft
$161/Sq Ft
Est. Value
About This Home
This home is located at 143 Watkins Rd, Blanchester, OH 45107 and is currently estimated at $260,059, approximately $160 per square foot. 143 Watkins Rd is a home located in Clinton County with nearby schools including Putman Elementary School, Blanchester Middle School, and Blanchester High School.
Ownership History
Date
Name
Owned For
Owner Type
Purchase Details
Closed on
Mar 19, 2021
Sold by
Bandow Carrie L
Bought by
Dameron Matthew and Dameron Jennifer
Current Estimated Value
Home Financials for this Owner
Home Financials are based on the most recent Mortgage that was taken out on this home.
Original Mortgage
$151,920
Outstanding Balance
$134,705
Interest Rate
2.73%
Mortgage Type
New Conventional
Estimated Equity
$125,354
Purchase Details
Closed on
Apr 7, 2020
Sold by
Bandow Robert T
Bought by
Bandow Carrie L
Home Financials for this Owner
Home Financials are based on the most recent Mortgage that was taken out on this home.
Original Mortgage
$151,579
Interest Rate
3.2%
Mortgage Type
Future Advance Clause Open End Mortgage
Purchase Details
Closed on
May 6, 2005
Sold by
Back Clarence
Bought by
Bandow Robert T and Bandow Carrie L
Home Financials for this Owner
Home Financials are based on the most recent Mortgage that was taken out on this home.
Original Mortgage
$129,000
Interest Rate
6.05%
Mortgage Type
Purchase Money Mortgage
Purchase Details
Closed on
Apr 29, 2005
Sold by
Back Clarence
Bought by
Bandow Robert T and Bandow Carrie L
Home Financials for this Owner
Home Financials are based on the most recent Mortgage that was taken out on this home.
Original Mortgage
$129,000
Interest Rate
6.05%
Mortgage Type
Purchase Money Mortgage
Purchase Details
Closed on
Jul 6, 2001
Sold by
Anderson Charles A
Bought by
Back Clarence
Purchase Details
Closed on
Jan 1, 1990
Bought by
Anderson Charles Anthony
Create a Home Valuation Report for This Property
The Home Valuation Report is an in-depth analysis detailing your home's value as well as a comparison with similar homes in the area
Home Values in the Area
Average Home Value in this Area
Purchase History
| Date | Buyer | Sale Price | Title Company |
|---|---|---|---|
| Dameron Matthew | $189,900 | None Available | |
| Bandow Carrie L | -- | None Available | |
| Bandow Robert T | $150,500 | -- | |
| Bandow Robert T | $150,500 | -- | |
| Back Clarence | $90,000 | -- | |
| Anderson Charles Anthony | -- | -- |
Source: Public Records
Mortgage History
| Date | Status | Borrower | Loan Amount |
|---|---|---|---|
| Open | Dameron Matthew | $151,920 | |
| Closed | Bandow Carrie L | $151,579 | |
| Closed | Bandow Robert T | $129,000 |
Source: Public Records
Tax History
| Year | Tax Paid | Tax Assessment Tax Assessment Total Assessment is a certain percentage of the fair market value that is determined by local assessors to be the total taxable value of land and additions on the property. | Land | Improvement |
|---|---|---|---|---|
| 2025 | $2,135 | $60,520 | $5,740 | $54,780 |
| 2024 | $2,135 | $60,520 | $5,740 | $54,780 |
| 2023 | $2,267 | $60,520 | $5,740 | $54,780 |
| 2022 | $1,725 | $41,700 | $4,950 | $36,750 |
| 2021 | $1,808 | $41,700 | $4,950 | $36,750 |
| 2020 | $2,548 | $41,700 | $4,950 | $36,750 |
| 2019 | $1,354 | $30,350 | $4,950 | $25,400 |
| 2018 | $1,360 | $30,350 | $4,950 | $25,400 |
| 2017 | $1,332 | $30,350 | $4,950 | $25,400 |
| 2016 | $1,115 | $26,690 | $4,990 | $21,700 |
| 2015 | $1,070 | $25,610 | $4,990 | $20,620 |
| 2013 | $1,200 | $27,880 | $4,990 | $22,890 |
Source: Public Records
Map
Nearby Homes
- 1 Middleboro Rd
- 117 Pansy Pike
- 157 Pansy Pike
- 213 N Broadway St
- 9 Pansy Pike
- 11 Pansy Pike
- 12 Pansy Pike
- 10 Pansy Pike
- 502 Railroad St
- 656 W Main St
- 501 E Johns St
- 203 E Main St
- 305 E Main St
- 753 W Main St
- 308 S Broadway St
- 143 W Fancy St
- 503 S Broadway St
- 816 E Center St
- 501 S Wright St
- 0 Ohio 123 Unit 11 938995
- 157 Watkins Rd
- 139 Watkins Rd
- 137 Watkins Rd
- 133 Watkins Rd
- 129 Watkins Rd
- 161 Watkins Rd
- 165 Watkins Rd
- 125 Watkins Rd
- 228 Highland Ave
- 238 Highland Ave
- 240 Highland Ave
- 224 Highland Ave
- 121 Watkins Rd
- 0 Highland Ave Unit 1752511
- 119 Watkins Rd
- 285 Watkins Rd
- 216 Highland Ave
- 241 Highland Ave Unit 241
- 233 Highland Ave
- 237 Highland Ave
Your Personal Tour Guide
Ask me questions while you tour the home.