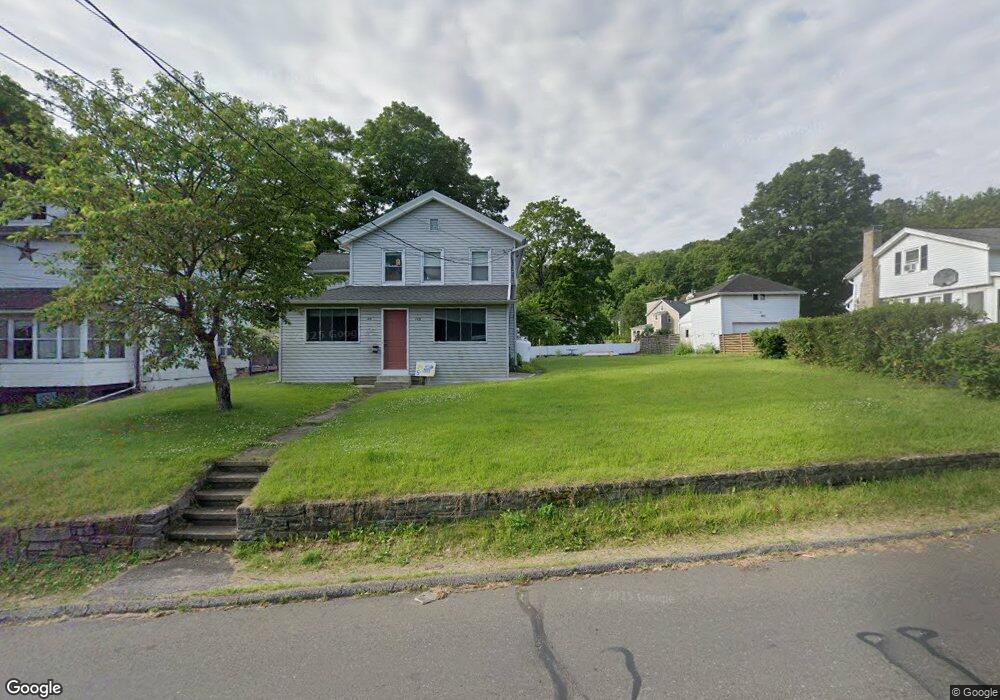
143 West St Seymour, CT 06483
Estimated Value: $304,057 - $462,000
4
Beds
2
Baths
1,926
Sq Ft
$204/Sq Ft
Est. Value
About This Home
This home is located at 143 West St, Seymour, CT 06483 and is currently estimated at $392,514, approximately $203 per square foot. 143 West St is a home located in New Haven County with nearby schools including Bungay Elementary School, Seymour Middle School, and Seymour High School.
Ownership History
Date
Name
Owned For
Owner Type
Purchase Details
Closed on
Oct 2, 2007
Sold by
Samuelson Arthur W
Bought by
Siciliano Lorenzo
Current Estimated Value
Home Financials for this Owner
Home Financials are based on the most recent Mortgage that was taken out on this home.
Original Mortgage
$184,000
Interest Rate
6.65%
Purchase Details
Closed on
Jul 25, 2000
Sold by
Gesek Ronald J
Bought by
Samuelson Arthur W
Create a Home Valuation Report for This Property
The Home Valuation Report is an in-depth analysis detailing your home's value as well as a comparison with similar homes in the area
Home Values in the Area
Average Home Value in this Area
Purchase History
| Date | Buyer | Sale Price | Title Company |
|---|---|---|---|
| Siciliano Lorenzo | $230,000 | -- | |
| Samuelson Arthur W | $135,500 | -- |
Source: Public Records
Mortgage History
| Date | Status | Borrower | Loan Amount |
|---|---|---|---|
| Open | Samuelson Arthur W | $164,000 | |
| Closed | Samuelson Arthur W | $184,000 |
Source: Public Records
Tax History Compared to Growth
Tax History
| Year | Tax Paid | Tax Assessment Tax Assessment Total Assessment is a certain percentage of the fair market value that is determined by local assessors to be the total taxable value of land and additions on the property. | Land | Improvement |
|---|---|---|---|---|
| 2025 | $4,607 | $166,180 | $34,020 | $132,160 |
| 2024 | $5,098 | $138,390 | $27,020 | $111,370 |
| 2023 | $4,979 | $138,390 | $27,020 | $111,370 |
| 2022 | $4,925 | $138,390 | $27,020 | $111,370 |
| 2021 | $4,804 | $138,390 | $27,020 | $111,370 |
| 2020 | $4,017 | $111,580 | $31,780 | $79,800 |
| 2019 | $4,017 | $111,580 | $31,780 | $79,800 |
| 2018 | $4,017 | $111,580 | $31,780 | $79,800 |
| 2017 | $4,017 | $111,580 | $31,780 | $79,800 |
| 2016 | $4,017 | $111,580 | $31,780 | $79,800 |
| 2015 | $4,433 | $128,170 | $35,700 | $92,470 |
| 2014 | $4,363 | $128,170 | $35,700 | $92,470 |
Source: Public Records
Map
Nearby Homes
- 29 George St
- 61 Pershing Ave
- 202 W Church St
- 235 W Church St
- 11 Oxford Rd
- 28 Brook St
- 26-28 S Main St
- 4 Brook St
- 17 Grand St
- 20 Cherry St
- 77 S Main St
- 38 Sanford St
- 36 Bungay Terrace
- 92 Balance Rock Rd Unit 9
- 139 Derby Ave
- 26 Balance Rock Rd Unit 16
- 27 Wood St
- 50 Bissell Place
- 9 Wooster St
- 32 Roberts St