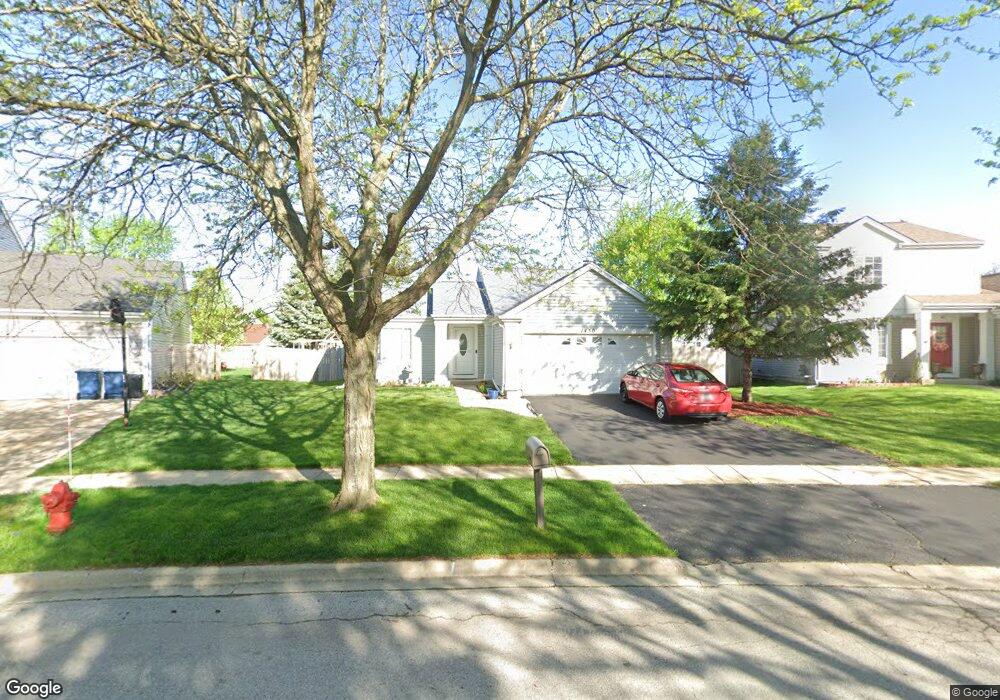
1430 Bent Oak Trail Aurora, IL 60506
Edgelawn Randall NeighborhoodEstimated Value: $328,000 - $346,000
2
Beds
2
Baths
1,440
Sq Ft
$232/Sq Ft
Est. Value
About This Home
This home is located at 1430 Bent Oak Trail, Aurora, IL 60506 and is currently estimated at $334,750, approximately $232 per square foot. 1430 Bent Oak Trail is a home located in Kane County with nearby schools including Smith Elementary School, Jewel Middle School, and West Aurora High School.
Ownership History
Date
Name
Owned For
Owner Type
Purchase Details
Closed on
Jan 10, 2019
Sold by
Orduna Alicia A
Bought by
Sluis Michael D and Orduna Lisa I
Current Estimated Value
Home Financials for this Owner
Home Financials are based on the most recent Mortgage that was taken out on this home.
Original Mortgage
$160,000
Outstanding Balance
$141,238
Interest Rate
4.8%
Mortgage Type
New Conventional
Estimated Equity
$193,512
Purchase Details
Closed on
Sep 29, 1998
Sold by
Klocek Edward J
Bought by
Orduna Vidal T and Orduna Alicia A
Home Financials for this Owner
Home Financials are based on the most recent Mortgage that was taken out on this home.
Original Mortgage
$125,000
Interest Rate
6.97%
Create a Home Valuation Report for This Property
The Home Valuation Report is an in-depth analysis detailing your home's value as well as a comparison with similar homes in the area
Home Values in the Area
Average Home Value in this Area
Purchase History
| Date | Buyer | Sale Price | Title Company |
|---|---|---|---|
| Sluis Michael D | $200,000 | Chicago Title Insurance Co | |
| Orduna Vidal T | $135,000 | Chicago Title Insurance Co |
Source: Public Records
Mortgage History
| Date | Status | Borrower | Loan Amount |
|---|---|---|---|
| Open | Sluis Michael D | $160,000 | |
| Previous Owner | Orduna Vidal T | $125,000 |
Source: Public Records
Tax History Compared to Growth
Tax History
| Year | Tax Paid | Tax Assessment Tax Assessment Total Assessment is a certain percentage of the fair market value that is determined by local assessors to be the total taxable value of land and additions on the property. | Land | Improvement |
|---|---|---|---|---|
| 2024 | $6,254 | $86,989 | $18,563 | $68,426 |
| 2023 | $5,972 | $77,724 | $16,586 | $61,138 |
| 2022 | $5,746 | $70,916 | $15,133 | $55,783 |
| 2021 | $5,484 | $66,024 | $14,089 | $51,935 |
| 2020 | $5,933 | $69,375 | $13,087 | $56,288 |
| 2019 | $5,210 | $64,277 | $12,125 | $52,152 |
| 2018 | $4,673 | $57,812 | $11,215 | $46,597 |
| 2017 | $5,337 | $57,853 | $10,334 | $47,519 |
| 2016 | $5,200 | $54,946 | $8,858 | $46,088 |
| 2015 | -- | $48,345 | $7,617 | $40,728 |
| 2014 | -- | $44,193 | $7,326 | $36,867 |
| 2013 | -- | $44,698 | $7,221 | $37,477 |
Source: Public Records
Map
Nearby Homes
- 1532 Golden Oaks Pkwy
- 910 Southbridge Dr
- 1035 Newcastle Ln
- 795 N Elmwood Dr
- 972 Westgate Dr
- 781 N Elmwood Dr
- 1815 Brighton Cir
- 833 N Randall Rd Unit C4
- 461 Sullivan Rd
- 1351 Monomoy St Unit D
- 1389 Monomoy St Unit B2
- 1104 New Haven Ave
- 967 Sapphire Ln
- 959 Sapphire Ln
- 963 Sapphire Ln
- 740 N Elmwood Dr
- 960 Sapphire Ln
- 964 Sapphire Ln
- 1421 Heather Dr
- 742 N Glenwood Place
- 1440 Bent Oak Trail
- 1420 Bent Oak Trail
- 1452 Golden Oaks Pkwy
- 1450 Bent Oak Trail
- 1456 Golden Oaks Pkwy
- 1410 Bent Oak Trail
- 1444 Golden Oaks Pkwy
- 1431 Bent Oak Trail
- 1460 Golden Oaks Pkwy
- 1421 Bent Oak Trail
- 1441 Bent Oak Trail
- 1460 Bent Oak Trail
- 1400 Bent Oak Trail
- 1440 Golden Oaks Pkwy
- 1391 Bent Oak Trail
- 1175 Red Oak Trail
- 1183 Red Oak Trail
- 1390 Bent Oak Trail
- 1436 Golden Oaks Pkwy
- 1201 Lone Oak Trail