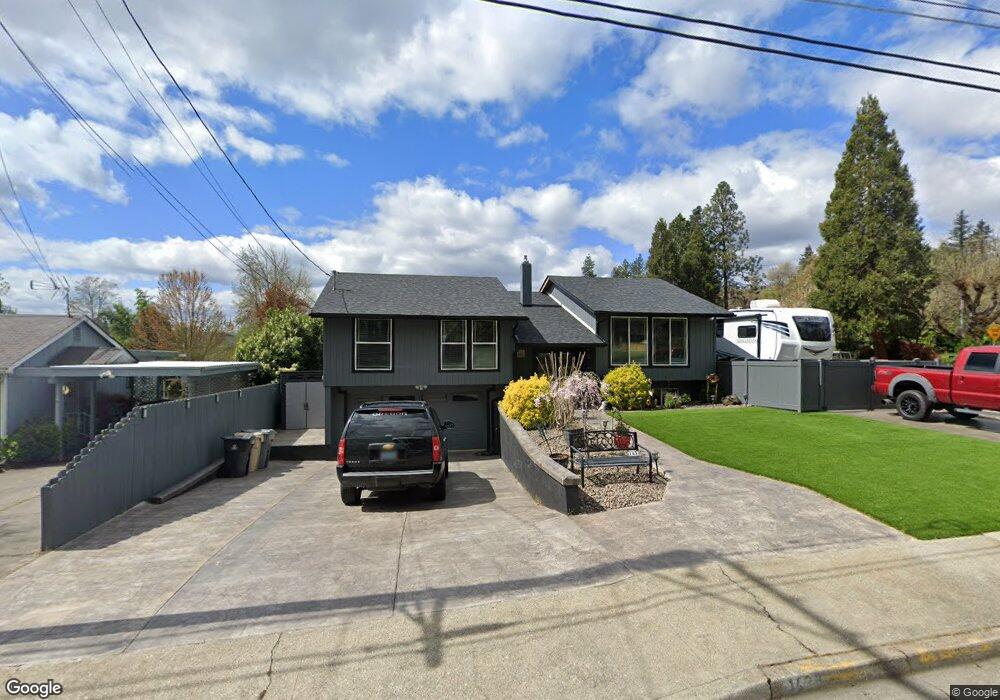
1430 NE 10th St Grants Pass, OR 97526
Estimated Value: $392,417 - $482,000
3
Beds
3
Baths
1,322
Sq Ft
$331/Sq Ft
Est. Value
About This Home
This home is located at 1430 NE 10th St, Grants Pass, OR 97526 and is currently estimated at $437,209, approximately $330 per square foot. 1430 NE 10th St is a home located in Josephine County with nearby schools including Lincoln Elementary School, North Middle School, and Grants Pass High School.
Ownership History
Date
Name
Owned For
Owner Type
Purchase Details
Closed on
Sep 18, 2020
Sold by
Simons Deborah L and Simons Charles A
Bought by
Simons Charles Albert and Simons Deborah Lynn
Current Estimated Value
Home Financials for this Owner
Home Financials are based on the most recent Mortgage that was taken out on this home.
Original Mortgage
$285,374
Interest Rate
2.8%
Mortgage Type
New Conventional
Purchase Details
Closed on
Mar 22, 2017
Sold by
Jump Deborah Lynn
Bought by
Simons Charles Albert and Simons Deborah Lynn
Purchase Details
Closed on
Jun 29, 2012
Sold by
Jump Deborah Lynn and Breckner Deborah Lynn
Bought by
Jump Deborah Lynn
Home Financials for this Owner
Home Financials are based on the most recent Mortgage that was taken out on this home.
Original Mortgage
$329,100
Interest Rate
3.74%
Mortgage Type
New Conventional
Create a Home Valuation Report for This Property
The Home Valuation Report is an in-depth analysis detailing your home's value as well as a comparison with similar homes in the area
Home Values in the Area
Average Home Value in this Area
Purchase History
| Date | Buyer | Sale Price | Title Company |
|---|---|---|---|
| Simons Charles Albert | -- | Amerititle | |
| Simons Deborah L | -- | Vantage Point Title Inc | |
| Simons Charles Albert | -- | None Available | |
| Jump Deborah Lynn | -- | Fa |
Source: Public Records
Mortgage History
| Date | Status | Borrower | Loan Amount |
|---|---|---|---|
| Closed | Simons Deborah L | $285,374 | |
| Closed | Jump Deborah Lynn | $329,100 |
Source: Public Records
Tax History Compared to Growth
Tax History
| Year | Tax Paid | Tax Assessment Tax Assessment Total Assessment is a certain percentage of the fair market value that is determined by local assessors to be the total taxable value of land and additions on the property. | Land | Improvement |
|---|---|---|---|---|
| 2025 | $3,555 | $273,740 | -- | -- |
| 2024 | $3,555 | $265,770 | -- | -- |
| 2023 | $3,452 | $258,030 | $0 | $0 |
| 2022 | $3,364 | $250,520 | -- | -- |
| 2021 | $3,160 | $243,230 | $0 | $0 |
| 2020 | $3,069 | $236,150 | $0 | $0 |
| 2019 | $2,980 | $229,280 | $0 | $0 |
| 2018 | $3,032 | $222,610 | $0 | $0 |
| 2017 | $3,010 | $216,130 | $0 | $0 |
| 2016 | $2,646 | $209,840 | $0 | $0 |
| 2015 | $2,559 | $203,730 | $0 | $0 |
| 2014 | $2,489 | $197,800 | $0 | $0 |
Source: Public Records
Map
Nearby Homes
- 1345 NE 9th St
- 1690 NE Beacon Dr
- 1051 NE Pepperwood Dr
- 1448 NE Jennifer Way
- 1117 NE Memorial Dr
- 1891 NE Beacon Dr
- 219 NE Outlook Ave
- 946 NE 12th St
- 918 NE 10th St
- 1393 NW Conklin Ave
- 909 NE 11th St
- 1021 NW Conklin Ave
- 1502 NW Lawnridge Ave
- 1523 NW Thompson Way
- 1337 NW Gilbert Way
- 702 NE A St
- 807 NW 5th St
- 715 NE A St
- 751 NW 4th St
- 728 NW 6th St
- 0 NE Dewey Dr NE
- 1428 NE 10th St
- 975 NE Dewey Dr
- 1420 NE 10th St
- 970 NE Dewey Dr
- 964 Providence Way
- 961 NE Dewey Dr
- 1002 NE Dewey Dr
- 1444 NE 10th St
- 952 Providence Way
- 960 NE Dewey Dr
- 952 NE Providence Way
- 1429 NE 10th St
- 1419 NE 10th St
- 1408 NE 10th St
- 965 Providence Way
- 939 NE Dewey Dr
- 1006 NE Dewey Dr
- 1443 NE 10th St
- 950 NE Dewey Dr