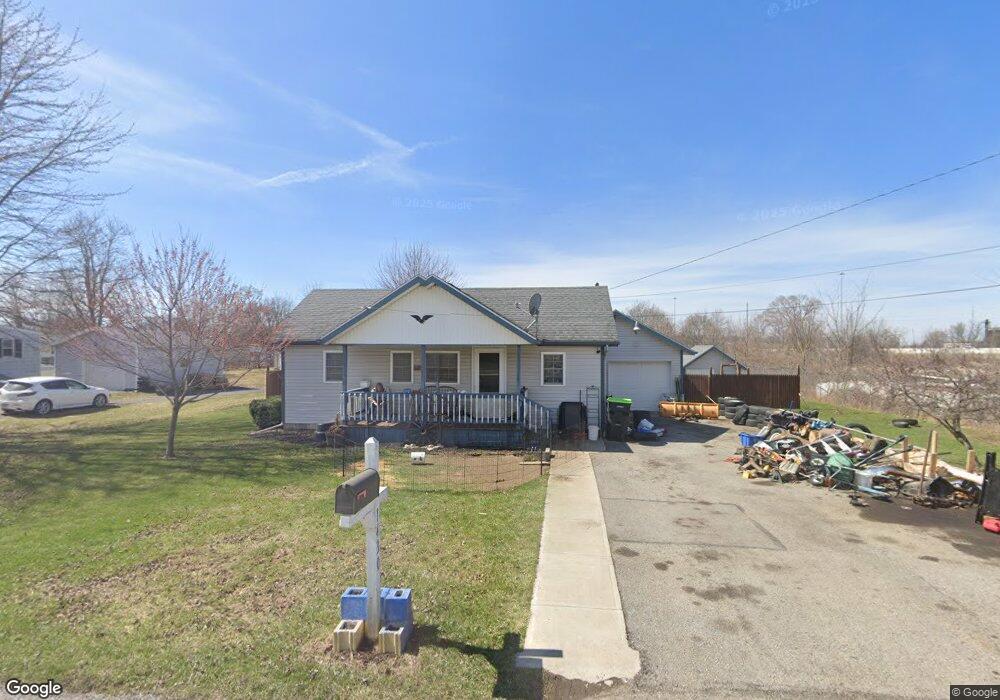
1430 Tappan St Findlay, OH 45840
Estimated Value: $121,000 - $136,808
2
Beds
1
Bath
813
Sq Ft
$159/Sq Ft
Est. Value
About This Home
This home is located at 1430 Tappan St, Findlay, OH 45840 and is currently estimated at $129,202, approximately $158 per square foot. 1430 Tappan St is a home located in Hancock County with nearby schools including Chamberlin Hill Elementary School, Jefferson Elementary School, and Donnell Middle School.
Ownership History
Date
Name
Owned For
Owner Type
Purchase Details
Closed on
Sep 11, 2019
Sold by
Myers Frederick G
Bought by
Reichley Amanda
Current Estimated Value
Home Financials for this Owner
Home Financials are based on the most recent Mortgage that was taken out on this home.
Original Mortgage
$80,119
Outstanding Balance
$70,321
Interest Rate
3.7%
Mortgage Type
New Conventional
Estimated Equity
$58,881
Purchase Details
Closed on
Feb 4, 2019
Sold by
Myers Ford Tonya Lynn
Bought by
Myers Frederick G
Purchase Details
Closed on
Jan 6, 2009
Sold by
Fannie Mae
Bought by
Myers Kevin G
Purchase Details
Closed on
Jul 10, 2008
Sold by
Houck Ryan A and Houck Onna L
Bought by
Federal National Mortgage Association
Purchase Details
Closed on
Jan 15, 1993
Bought by
Houck Ryan Andrew
Purchase Details
Closed on
Sep 26, 1990
Bought by
Houck Betty J
Create a Home Valuation Report for This Property
The Home Valuation Report is an in-depth analysis detailing your home's value as well as a comparison with similar homes in the area
Home Values in the Area
Average Home Value in this Area
Purchase History
| Date | Buyer | Sale Price | Title Company |
|---|---|---|---|
| Reichley Amanda | $83,000 | Golden Key Title Agency | |
| Myers Frederick G | -- | None Available | |
| Myers Kevin G | $15,000 | Accutitle Agency Inc | |
| Federal National Mortgage Association | $21,334 | None Available | |
| Houck Ryan Andrew | $31,000 | -- | |
| Houck Betty J | -- | -- |
Source: Public Records
Mortgage History
| Date | Status | Borrower | Loan Amount |
|---|---|---|---|
| Open | Reichley Amanda | $80,119 |
Source: Public Records
Tax History Compared to Growth
Tax History
| Year | Tax Paid | Tax Assessment Tax Assessment Total Assessment is a certain percentage of the fair market value that is determined by local assessors to be the total taxable value of land and additions on the property. | Land | Improvement |
|---|---|---|---|---|
| 2024 | $1,323 | $37,230 | $9,510 | $27,720 |
| 2023 | $1,325 | $37,230 | $9,510 | $27,720 |
| 2022 | $1,320 | $37,230 | $9,510 | $27,720 |
| 2021 | $1,224 | $30,060 | $9,780 | $20,280 |
| 2020 | $1,224 | $30,060 | $9,780 | $20,280 |
| 2019 | $1,199 | $30,060 | $9,780 | $20,280 |
| 2018 | $1,134 | $25,420 | $9,780 | $15,640 |
| 2017 | $1,135 | $25,420 | $9,780 | $15,640 |
| 2016 | $1,129 | $25,420 | $9,780 | $15,640 |
| 2015 | $1,041 | $23,150 | $9,780 | $13,370 |
| 2014 | $1,041 | $23,150 | $9,780 | $13,370 |
| 2012 | $1,049 | $23,150 | $9,780 | $13,370 |
Source: Public Records
Map
Nearby Homes
- 0 Bushwillow Dr Unit Lot 154
- 0 Bushwillow Dr Lot 156 Unit 6079046
- 0 Rock Candy Rd Lot 162 Unit 6079070
- 0 Bushwillow Dr Unit Lot 156
- 0 Bearcat Way Or 0 Rock Candy Rd Lot 167 Unit 6079083
- 0 Bushwillow Dr Lot 154 Unit 6079043
- 0 Rock Candy Rd Lot 171 Unit 6079088
- 0 County Road 99 Lot 2 Unit 6081480
- 0 Rock Candy Rd Lot 159 Unit 6079053
- 0 Bushwillow Dr Or Rock Candy Rd Lot 157 Unit 6079052
- 0 Bushwillow Dr Unit Lot 155
- 0 Rock Candy Rd Or Bushwillow Dr Lot 173 Unit 6079093
- 0 Rock Candy Rd Lot 168 Unit 6079085
- 0 Rock Candy Rd Lot 170 Unit 6079087
- 0 Bushwillow Dr Lot 155 Unit 6079044
- 1604 Payne Ave
- 0 Waterford Way Lot 78 Unit 6089639
- 535 Palm Dr
- 1421 Hurd Ave
- 9653 Early Dr