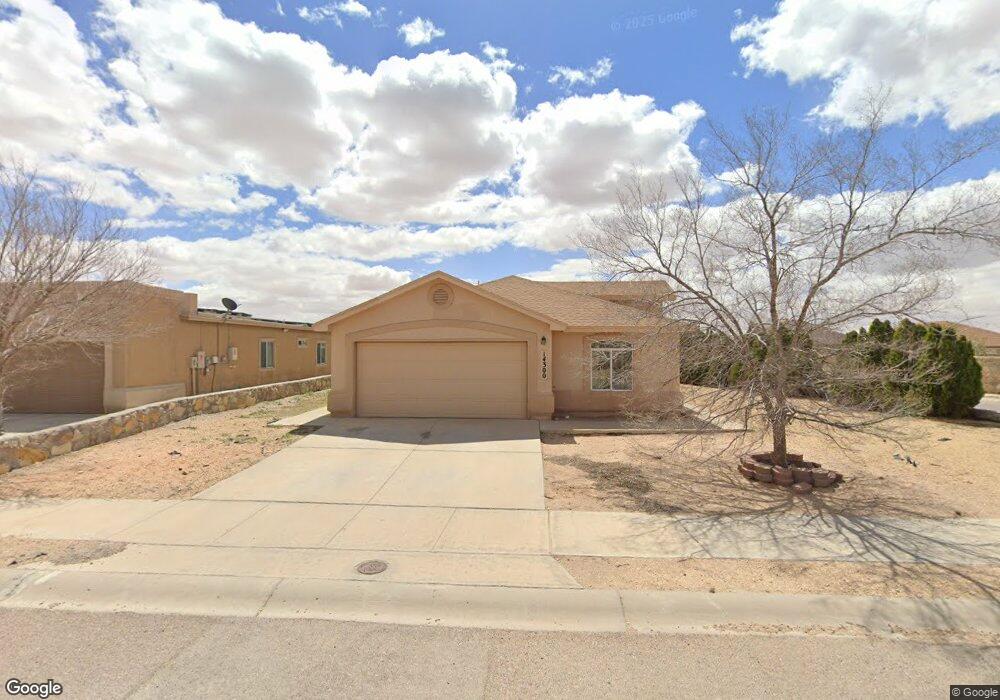
14300 Desert Orchid Dr Unit 1 El Paso, TX 79928
Estimated Value: $216,000 - $220,091
4
Beds
2
Baths
1,421
Sq Ft
$153/Sq Ft
Est. Value
About This Home
This home is located at 14300 Desert Orchid Dr Unit 1, El Paso, TX 79928 and is currently estimated at $217,523, approximately $153 per square foot. 14300 Desert Orchid Dr Unit 1 is a home located in El Paso County with nearby schools including Desert Hills Elementary School, Horizon Middle School, and Horizon High School.
Ownership History
Date
Name
Owned For
Owner Type
Purchase Details
Closed on
Oct 24, 2023
Sold by
Hernandez Jose Marcos and Hernandez Claudia
Bought by
Patriot Mortgage Company Inc and Hernandez
Current Estimated Value
Purchase Details
Closed on
Nov 3, 2010
Sold by
Saratoga Homes Inc
Bought by
Hernandez Jose Marcos
Home Financials for this Owner
Home Financials are based on the most recent Mortgage that was taken out on this home.
Original Mortgage
$136,735
Interest Rate
4.32%
Mortgage Type
New Conventional
Purchase Details
Closed on
Jun 8, 2010
Sold by
Jnc Land Lp
Bought by
Saratoga Homes Inc
Home Financials for this Owner
Home Financials are based on the most recent Mortgage that was taken out on this home.
Original Mortgage
$985,125
Interest Rate
5.02%
Mortgage Type
Purchase Money Mortgage
Create a Home Valuation Report for This Property
The Home Valuation Report is an in-depth analysis detailing your home's value as well as a comparison with similar homes in the area
Home Values in the Area
Average Home Value in this Area
Purchase History
| Date | Buyer | Sale Price | Title Company |
|---|---|---|---|
| Patriot Mortgage Company Inc | $180,000 | None Listed On Document | |
| Hernandez Jose Marcos | -- | None Available | |
| Saratoga Homes Inc | -- | None Available |
Source: Public Records
Mortgage History
| Date | Status | Borrower | Loan Amount |
|---|---|---|---|
| Previous Owner | Hernandez Jose Marcos | $136,735 | |
| Previous Owner | Saratoga Homes Inc | $985,125 |
Source: Public Records
Tax History Compared to Growth
Tax History
| Year | Tax Paid | Tax Assessment Tax Assessment Total Assessment is a certain percentage of the fair market value that is determined by local assessors to be the total taxable value of land and additions on the property. | Land | Improvement |
|---|---|---|---|---|
| 2025 | $7,106 | $231,659 | $24,426 | $207,233 |
| 2024 | $7,106 | $221,297 | $24,426 | $196,871 |
| 2023 | $7,106 | $190,389 | $0 | $0 |
| 2022 | $5,612 | $173,081 | $0 | $0 |
| 2021 | $5,615 | $157,346 | $24,426 | $132,920 |
| 2020 | $5,190 | $149,414 | $24,426 | $124,988 |
| 2018 | $4,976 | $148,264 | $24,426 | $123,838 |
| 2017 | $4,579 | $137,888 | $24,426 | $113,462 |
| 2016 | $3,901 | $117,465 | $24,426 | $93,039 |
| 2015 | $3,912 | $117,465 | $24,426 | $93,039 |
| 2014 | $3,912 | $123,831 | $24,426 | $99,405 |
Source: Public Records
Map
Nearby Homes
- 14267 Desert Cactus Dr
- 14395 Desert Sage Dr
- 14370 Desert Sage Dr
- 816 Desert Moon Dr
- 14240 Desert Mesquite Dr
- 14237 Desert Stone Dr
- 920 Sandhurst Place
- 761 Desert Star Dr
- 757 Desert Star Dr
- 952 Sandhurst Place
- 916 Sandhurst Place
- 753 Desert Silver Dr
- 933 Sandhurst Place
- 13973 Lorenz Ave
- 760 Desert Ash Dr
- 916 Summer Lake St
- 768 Paseo Del Agua St
- Adam Plan at Summer Sky - North
- Mesilla Plan at Summer Sky - North
- Madison Plan at Summer Sky - North
- 14300 Desert Orchid Dr
- 14304 Desert Orchid Dr
- 14292 Desert Orchid Dr
- 14305 Desert Sky Dr
- 14293 Desert Sky Dr
- 14312 Desert Orchid Dr
- 14301 Desert Orchid Dr
- 14301 Desert Orchid Dr Unit 1
- 14305 Desert Orchid Dr
- 14288 Desert Orchid Dr
- 14309 Desert Sky Dr
- 14309 Desert Orchid Dr
- 14289 Desert Sky Dr
- 14293 Desert Orchid Dr
- 14316 Desert Orchid Dr
- 14313 Desert Orchid Dr
- 14313 Desert Sky Dr
- 14289 Desert Orchid Dr
- 14285 Desert Sky Dr
- 14317 Desert Orchid Dr