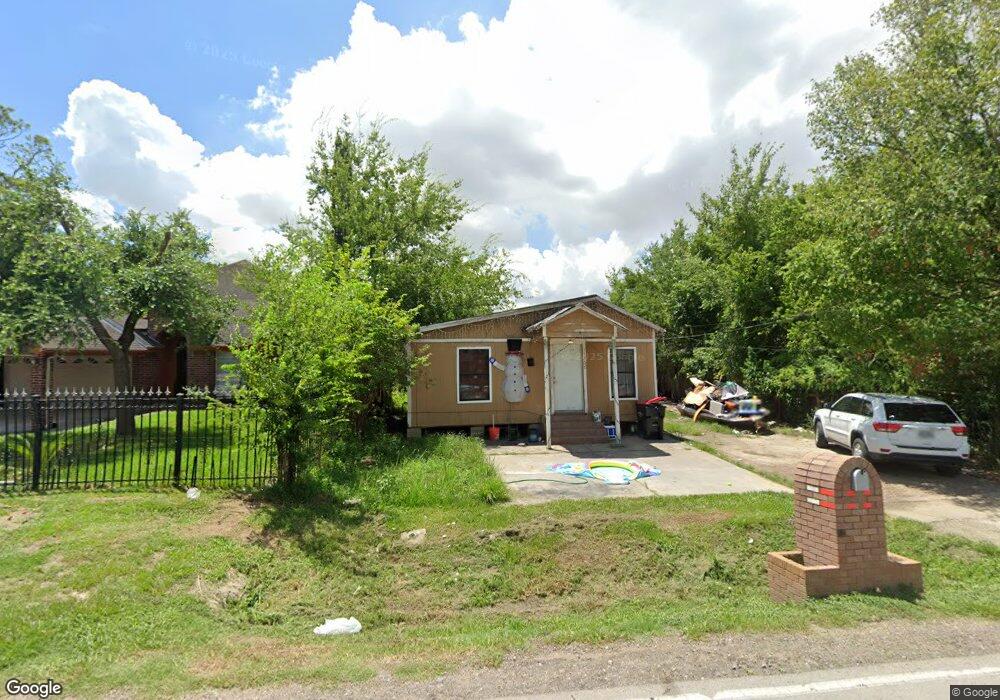
14306 Brownwood St Houston, TX 77015
Estimated Value: $119,000 - $173,000
4
Beds
1
Bath
1,150
Sq Ft
$129/Sq Ft
Est. Value
About This Home
This home is located at 14306 Brownwood St, Houston, TX 77015 and is currently estimated at $148,155, approximately $128 per square foot. 14306 Brownwood St is a home located in Harris County with nearby schools including Cloverleaf Elementary School, Cobb 6th Grade Campus, and North Shore Middle School.
Ownership History
Date
Name
Owned For
Owner Type
Purchase Details
Closed on
Nov 25, 2024
Sold by
Dela Vina Maria Ana and Dela David
Bought by
Sanchez Antonio
Current Estimated Value
Home Financials for this Owner
Home Financials are based on the most recent Mortgage that was taken out on this home.
Original Mortgage
$25,000
Outstanding Balance
$15,992
Interest Rate
6.32%
Mortgage Type
Seller Take Back
Estimated Equity
$132,163
Purchase Details
Closed on
Sep 23, 2015
Sold by
Castro Patricia C
Bought by
Dela Vina Maria Ana
Purchase Details
Closed on
Aug 11, 2011
Sold by
Castillo Laura B
Bought by
Castro Patricia C
Purchase Details
Closed on
Jul 14, 2004
Sold by
Partida Frank and Patrida Maria
Bought by
Castro Patricia and Castillo Laura
Purchase Details
Closed on
May 8, 2001
Sold by
Stokley F A
Bought by
Stokley F A and Stokley Rosemarie
Create a Home Valuation Report for This Property
The Home Valuation Report is an in-depth analysis detailing your home's value as well as a comparison with similar homes in the area
Home Values in the Area
Average Home Value in this Area
Purchase History
| Date | Buyer | Sale Price | Title Company |
|---|---|---|---|
| Sanchez Antonio | -- | None Listed On Document | |
| Sanchez Antonio | -- | None Listed On Document | |
| Dela Vina Maria Ana | -- | Attorney | |
| Castro Patricia C | -- | None Available | |
| Castro Patricia | -- | -- | |
| Stokley F A | -- | -- |
Source: Public Records
Mortgage History
| Date | Status | Borrower | Loan Amount |
|---|---|---|---|
| Open | Sanchez Antonio | $25,000 | |
| Closed | Sanchez Antonio | $25,000 |
Source: Public Records
Tax History Compared to Growth
Tax History
| Year | Tax Paid | Tax Assessment Tax Assessment Total Assessment is a certain percentage of the fair market value that is determined by local assessors to be the total taxable value of land and additions on the property. | Land | Improvement |
|---|---|---|---|---|
| 2025 | $2,425 | $103,994 | $53,750 | $50,244 |
| 2024 | $2,425 | $107,695 | $53,750 | $53,945 |
| 2023 | $2,425 | $108,233 | $32,250 | $75,983 |
| 2022 | $2,129 | $89,001 | $32,250 | $56,751 |
| 2021 | $1,853 | $71,689 | $25,532 | $46,157 |
| 2020 | $1,621 | $61,164 | $25,532 | $35,632 |
| 2019 | $1,385 | $49,539 | $25,532 | $24,007 |
| 2018 | $671 | $42,648 | $25,532 | $17,116 |
| 2017 | $1,111 | $39,825 | $25,532 | $14,293 |
| 2016 | $1,111 | $39,825 | $25,532 | $14,293 |
| 2015 | $888 | $39,825 | $25,532 | $14,293 |
| 2014 | $888 | $32,630 | $18,813 | $13,817 |
Source: Public Records
Map
Nearby Homes
- 14307 Laredo St
- 813 Barbara Mae St
- 816 Barbara Mae St
- 14500 Corpus Christi St Unit 4
- 14504 Corpus Christi St Unit 4
- 14506 Corpus Christi St Unit 4
- 14615 Victoria St
- 0 Victoria St
- 14613 Hillsboro St
- 14334 Texarkana St
- 638 Hollywood St
- 14619 Brownsville St
- 14512 Texarkana St
- 14750 Kenny St
- 639 Manor St
- 13842 Laredo St
- 1035 Nadolney St
- 14548 Gainesville St
- 14622 Kenny St
- 530 Frankie St Unit 1
- 14314 Brownwood St
- 943 Barbara Mae St
- 947 Barbara Mae St
- 14317 Greenville St Unit 5
- 14323 Greenville St
- 939 Barbara Mae St
- 14325 Brownwood St
- 14338 Brownwood St
- 14250 Brownwood St
- 14336 Brownwood St
- 14329 Greenville St Unit T
- 14329 Greenville St
- 14306 Greenville
- 14314 Greenville St
- 14243 Greenville St
- 14337 Brownwood St
- 14331 Greenville St
- 14310 Hershe St
- 14244 Brownwood St
- 14320 Greenville St