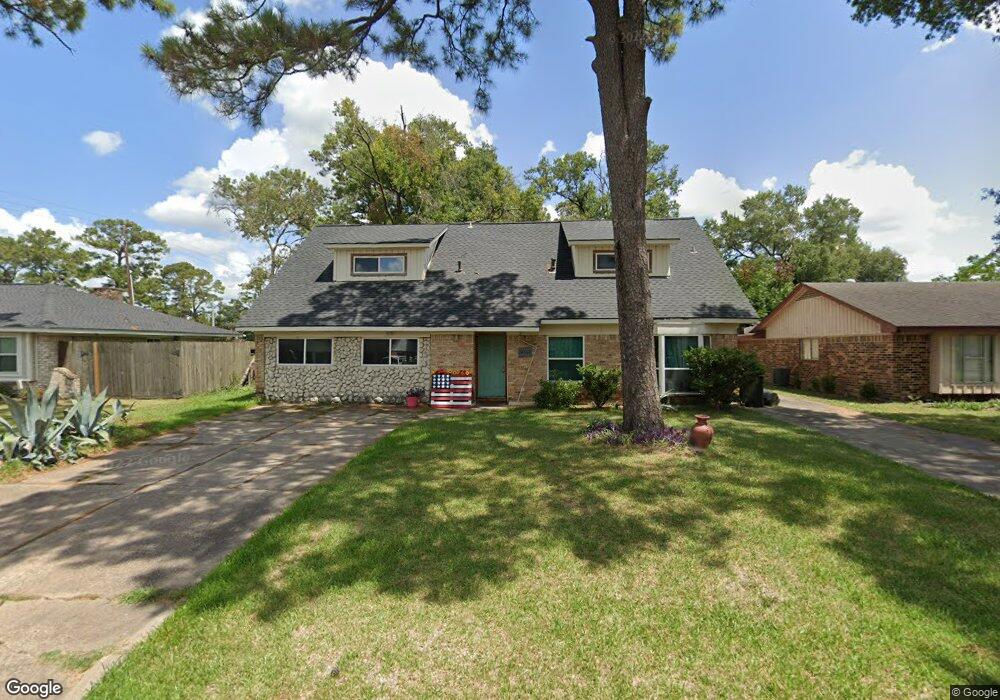
14307 Hollypark Dr Houston, TX 77015
Estimated Value: $240,000 - $275,000
5
Beds
2
Baths
2,700
Sq Ft
$96/Sq Ft
Est. Value
About This Home
This home is located at 14307 Hollypark Dr, Houston, TX 77015 and is currently estimated at $257,989, approximately $95 per square foot. 14307 Hollypark Dr is a home located in Harris County with nearby schools including North Shore Elementary School, Cobb 6th Grade Campus, and North Shore Middle School.
Ownership History
Date
Name
Owned For
Owner Type
Purchase Details
Closed on
Jul 30, 2020
Sold by
Thrower Chad and Thrower Catherine
Bought by
Thrower Jeremy and Thrower Amanda
Current Estimated Value
Purchase Details
Closed on
Jun 9, 2014
Sold by
Cloy John and Cloy Deborah
Bought by
Thrower Chad and Thrower Catherine
Purchase Details
Closed on
Jan 25, 2007
Sold by
Us Bank Na
Bought by
Clay John and Clay Deborah
Purchase Details
Closed on
Aug 1, 2006
Sold by
Benavidez Julia Salazar
Bought by
Us Bank Na and Home Equity Loan Trust 2004-He7
Purchase Details
Closed on
Jun 10, 1998
Sold by
Benavidez Jesus O
Bought by
Benavidez Julia Salazar
Home Financials for this Owner
Home Financials are based on the most recent Mortgage that was taken out on this home.
Original Mortgage
$72,000
Interest Rate
7.17%
Create a Home Valuation Report for This Property
The Home Valuation Report is an in-depth analysis detailing your home's value as well as a comparison with similar homes in the area
Home Values in the Area
Average Home Value in this Area
Purchase History
| Date | Buyer | Sale Price | Title Company |
|---|---|---|---|
| Thrower Jeremy | -- | None Available | |
| Thrower Chad | -- | None Available | |
| Clay John | -- | None Available | |
| Us Bank Na | $110,415 | None Available | |
| Benavidez Julia Salazar | -- | First American Title |
Source: Public Records
Mortgage History
| Date | Status | Borrower | Loan Amount |
|---|---|---|---|
| Previous Owner | Benavidez Julia Salazar | $72,000 |
Source: Public Records
Tax History Compared to Growth
Tax History
| Year | Tax Paid | Tax Assessment Tax Assessment Total Assessment is a certain percentage of the fair market value that is determined by local assessors to be the total taxable value of land and additions on the property. | Land | Improvement |
|---|---|---|---|---|
| 2025 | $2,535 | $209,912 | $61,464 | $148,448 |
| 2024 | $2,535 | $211,172 | $46,098 | $165,074 |
| 2023 | $2,535 | $243,390 | $46,098 | $197,292 |
| 2022 | $4,976 | $214,014 | $46,098 | $167,916 |
| 2021 | $4,294 | $169,764 | $36,110 | $133,654 |
| 2020 | $3,826 | $148,314 | $36,110 | $112,204 |
| 2019 | $3,855 | $142,972 | $26,891 | $116,081 |
| 2018 | $697 | $132,566 | $26,891 | $105,675 |
| 2017 | $3,278 | $127,667 | $26,891 | $100,776 |
| 2016 | $2,980 | $110,535 | $21,128 | $89,407 |
| 2015 | $2,623 | $101,309 | $21,128 | $80,181 |
| 2014 | $2,623 | $98,229 | $21,128 | $77,101 |
Source: Public Records
Map
Nearby Homes
- 14143 Roundstone Ln
- 14131 Woodforest Blvd
- 14422 Roundstone Ln
- 14415 Wadebridge Way
- 415 Sevenhampton Ln
- 14334 Texarkana St
- 14018 Duncannon Dr
- 14515 Duncannon Dr
- 638 Hollywood St
- 14510 Foxford Way
- 719 Manor St
- 14512 Texarkana St
- 14115 Lantern Ln
- 14615 Victoria St
- 0 Victoria St
- 335 Haymarket Ln
- 331 Haymarket Ln
- 530 Frankie St Unit 1
- 13907 Duncannon Dr
- 255 Taranto Ln
- 14311 Hollypark Dr
- 14303 Hollypark Dr
- 14306 Woodforest Blvd
- 14310 Woodforest Blvd
- 14315 Hollypark Dr
- 14302 Woodforest Blvd
- 14306 Hollypark Dr
- 14314 Woodforest Blvd
- 14302 Hollypark Dr
- 14310 Hollypark Dr
- 14231 Hollypark Dr
- 14319 Hollypark Dr
- 14314 Hollypark Dr
- 14318 Woodforest Blvd
- 14226 Woodforest Blvd
- 14230 Hollypark Dr
- 14323 Hollypark Dr
- 14227 Hollypark Dr
- 14318 Hollypark Dr
- 14322 Woodforest Blvd