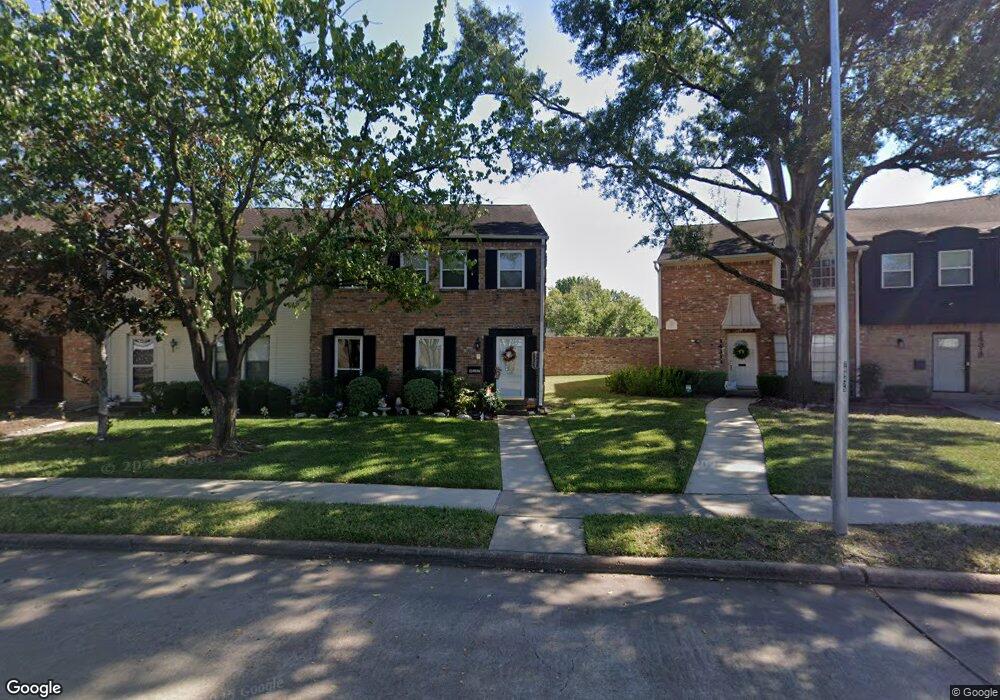
14307 Still Meadow Dr Houston, TX 77079
Energy Corridor NeighborhoodEstimated Value: $262,000 - $280,000
4
Beds
3
Baths
2,256
Sq Ft
$121/Sq Ft
Est. Value
About This Home
This home is located at 14307 Still Meadow Dr, Houston, TX 77079 and is currently estimated at $272,907, approximately $120 per square foot. 14307 Still Meadow Dr is a home located in Harris County with nearby schools including Thornwood Elementary School, Spring Forest Middle School, and Stratford High School.
Ownership History
Date
Name
Owned For
Owner Type
Purchase Details
Closed on
Nov 20, 2019
Sold by
Riopelle Marilyn L
Bought by
Riopelle Marilyn L
Current Estimated Value
Purchase Details
Closed on
Oct 28, 2013
Sold by
Kiszkiel Maciej Jan and Kiszkiel Anni
Bought by
Riopelle Leslie J and Riopelle James E
Home Financials for this Owner
Home Financials are based on the most recent Mortgage that was taken out on this home.
Original Mortgage
$85,000
Outstanding Balance
$59,626
Interest Rate
2.8%
Mortgage Type
Adjustable Rate Mortgage/ARM
Estimated Equity
$213,281
Purchase Details
Closed on
Nov 10, 2009
Sold by
Kiszkiel Christopher Paul
Bought by
Kiszkiel Maciej Jan and Kiszkiel Anni
Purchase Details
Closed on
Sep 24, 1998
Sold by
Kiszkiel Mikolaj Jan
Bought by
Kiszkiel Mike and Kiszkiel Christopher Paul
Create a Home Valuation Report for This Property
The Home Valuation Report is an in-depth analysis detailing your home's value as well as a comparison with similar homes in the area
Home Values in the Area
Average Home Value in this Area
Purchase History
| Date | Buyer | Sale Price | Title Company |
|---|---|---|---|
| Riopelle Marilyn L | -- | None Available | |
| Riopelle Leslie J | -- | Veritas Title | |
| Kiszkiel Maciej Jan | -- | None Available | |
| Kiszkiel Mike | -- | -- |
Source: Public Records
Mortgage History
| Date | Status | Borrower | Loan Amount |
|---|---|---|---|
| Open | Riopelle Leslie J | $85,000 |
Source: Public Records
Tax History Compared to Growth
Tax History
| Year | Tax Paid | Tax Assessment Tax Assessment Total Assessment is a certain percentage of the fair market value that is determined by local assessors to be the total taxable value of land and additions on the property. | Land | Improvement |
|---|---|---|---|---|
| 2025 | $4,552 | $263,049 | $65,273 | $197,776 |
| 2024 | $4,552 | $260,467 | $65,273 | $195,194 |
| 2023 | $4,552 | $275,929 | $65,273 | $210,656 |
| 2022 | $4,958 | $213,349 | $65,273 | $148,076 |
| 2021 | $4,707 | $192,786 | $65,273 | $127,513 |
| 2020 | $4,830 | $192,786 | $65,273 | $127,513 |
| 2019 | $5,351 | $204,398 | $50,768 | $153,630 |
| 2018 | $2,148 | $195,076 | $50,768 | $144,308 |
| 2017 | $5,103 | $195,076 | $50,768 | $144,308 |
| 2016 | $4,745 | $181,358 | $36,263 | $145,095 |
| 2015 | $3,543 | $181,358 | $36,263 | $145,095 |
| 2014 | $3,543 | $152,275 | $29,010 | $123,265 |
Source: Public Records
Map
Nearby Homes
- 1334 Country Place Dr
- 14325 Lost Meadow Ln
- 1310 Country Place Dr
- 14322 Misty Meadow Ln
- 14407 Still Meadow Dr
- 14213 Lost Meadow Ln
- 1381 Country Place Dr Unit 23
- 14226 Misty Meadow Ln
- 14151 Lost Meadow Ln
- 14143 Lost Meadow Ln
- 14311 Misty Meadow Ln
- 14387 Misty Meadow Ln
- 14435 Misty Meadow Ln
- 1147 Country Place Dr
- 14171 Misty Meadow Ln
- 1071 Country Place Dr Unit 1071
- 14123 Misty Meadow Ln
- 14507 Misty Meadow Ln
- 14571 Misty Meadow Ln
- 14535 Misty Meadow Ln
- 14305 Still Meadow Dr
- 14311 Still Meadow Dr
- 14311 Still Meadow Dr
- 14303 Still Meadow Dr
- 14313 Still Meadow Dr
- 14315 Still Meadow Dr
- 14317 Still Meadow Dr
- 14319 Still Meadow Dr
- 14385 Still Meadow Dr
- 14383 Still Meadow Dr
- 14387 Still Meadow Dr
- 14389 Still Meadow Dr
- 14369 Lost Meadow Ln
- 14367 Lost Meadow Ln
- 14365 Lost Meadow Ln
- 14321 Still Meadow Dr
- 14363 Lost Meadow Ln
- 14379 Still Meadow Dr
- 14361 Lost Meadow Ln
- 14377 Still Meadow Dr