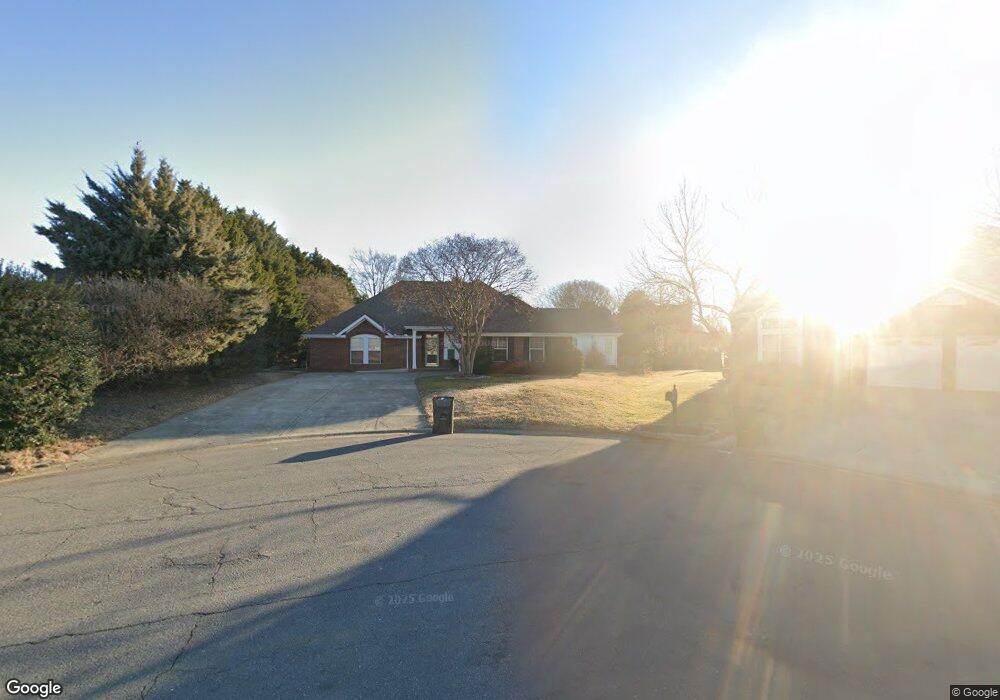
14309 Bluewing Teal Ct Unit 10 Charlotte, NC 28273
Yorkshire NeighborhoodEstimated Value: $510,000 - $541,000
3
Beds
2
Baths
2,253
Sq Ft
$235/Sq Ft
Est. Value
About This Home
This home is located at 14309 Bluewing Teal Ct Unit 10, Charlotte, NC 28273 and is currently estimated at $528,432, approximately $234 per square foot. 14309 Bluewing Teal Ct Unit 10 is a home located in Mecklenburg County with nearby schools including River Gate Elementary, Southwest Middle School, and Unity Classical Charter School.
Ownership History
Date
Name
Owned For
Owner Type
Purchase Details
Closed on
Aug 3, 2016
Sold by
Jimmy E Roberts
Bought by
Pavcne Dennis and Pavcne Dawna
Current Estimated Value
Home Financials for this Owner
Home Financials are based on the most recent Mortgage that was taken out on this home.
Original Mortgage
$275,702
Outstanding Balance
$219,978
Interest Rate
3.48%
Estimated Equity
$308,454
Purchase Details
Closed on
Nov 12, 2014
Sold by
Tpm Properties Lp
Bought by
Roberts Jimmy E and Roberts Donna J
Purchase Details
Closed on
Oct 22, 2014
Sold by
Morris Donna Carol and Morris Gregory P
Bought by
Tpm Properties Lp
Purchase Details
Closed on
Dec 30, 2009
Sold by
Clizbe John W and Clizbe Joann M
Bought by
Morris Donna Carol and Morris Gregory P
Home Financials for this Owner
Home Financials are based on the most recent Mortgage that was taken out on this home.
Original Mortgage
$218,469
Interest Rate
4.82%
Mortgage Type
FHA
Create a Home Valuation Report for This Property
The Home Valuation Report is an in-depth analysis detailing your home's value as well as a comparison with similar homes in the area
Home Values in the Area
Average Home Value in this Area
Purchase History
| Date | Buyer | Sale Price | Title Company |
|---|---|---|---|
| Pavcne Dennis | -- | -- | |
| Roberts Jimmy E | $230,000 | None Available | |
| Tpm Properties Lp | $168,000 | None Available | |
| Morris Donna Carol | $222,500 | None Available |
Source: Public Records
Mortgage History
| Date | Status | Borrower | Loan Amount |
|---|---|---|---|
| Open | Pavcne Dennis | $275,702 | |
| Closed | Pavcne Dennis | -- | |
| Previous Owner | Morris Donna Carol | $218,469 |
Source: Public Records
Tax History Compared to Growth
Tax History
| Year | Tax Paid | Tax Assessment Tax Assessment Total Assessment is a certain percentage of the fair market value that is determined by local assessors to be the total taxable value of land and additions on the property. | Land | Improvement |
|---|---|---|---|---|
| 2025 | $3,821 | $484,400 | $95,000 | $389,400 |
| 2024 | $3,821 | $484,400 | $95,000 | $389,400 |
| 2023 | $3,227 | $421,000 | $95,000 | $326,000 |
| 2022 | $2,622 | $258,700 | $60,000 | $198,700 |
| 2021 | $2,611 | $258,700 | $60,000 | $198,700 |
| 2020 | $2,604 | $258,700 | $60,000 | $198,700 |
| 2019 | $2,588 | $258,700 | $60,000 | $198,700 |
| 2018 | $2,501 | $185,000 | $35,000 | $150,000 |
| 2017 | $2,458 | $185,000 | $35,000 | $150,000 |
| 2016 | $2,448 | $185,000 | $35,000 | $150,000 |
| 2015 | $2,437 | $185,000 | $35,000 | $150,000 |
| 2014 | $2,438 | $185,000 | $35,000 | $150,000 |
Source: Public Records
Map
Nearby Homes
- 14406 Gadwall Ct
- 14021 Harlequin Dr
- 14115 Canvasback Dr
- 14606 Vaughan Dr
- 14025 Pytchley Ln
- 14727 Choate Cir
- 14725 Vaughan Dr
- 13617 Merton Woods Ln
- 14922 Rolling Sky Dr
- 14806 Karina Falls Ct
- 11929 Tanton Ln
- 14936 Forest Mist Way
- 12926 Canterbury Castle Dr
- 13617 Red Wine Ct
- 13506 Stephendale Dr
- 13505 Walkers Creek Dr
- 14505 Rhodes Hall Dr
- 11320 Wagonford Ln
- 11314 Bumpious Ct
- 11802 Woffington Ct
- 14309 Bluewing Teal Ct
- 14313 Bluewing Teal Ct
- 14312 Ruddy Ct
- 14318 Ruddy Ct
- 14316 King Eider Dr
- 14306 Ruddy Ct
- 14308 King Eider Dr
- 14324 King Eider Dr
- 14300 King Eider Dr
- 14314 Bluewing Teal Ct
- 14232 King Eider Dr
- 14332 King Eider Dr
- 14332 King Eider Dr Unit 1
- 14218 Ruddy Ct
- 14309 Widgeon Ct
- 14308 Bluewing Teal Ct
- 14308 Bluewing Teal Ct Unit 13
- 14401 Gadwall Ct
- 14210 Ruddy Ct
- 14210 Ruddy Ct Unit 15