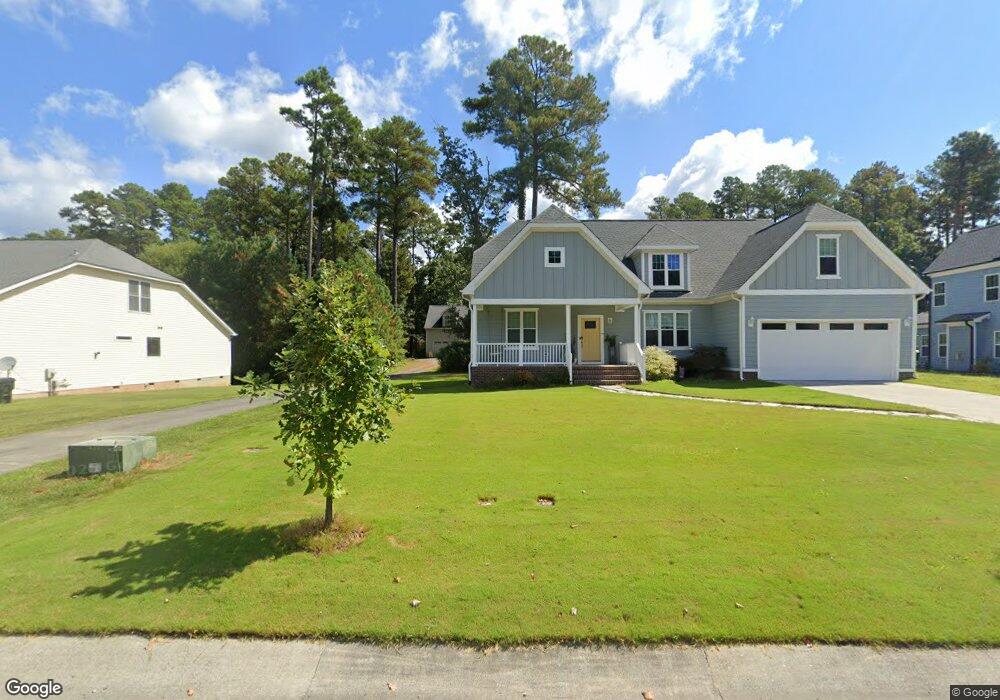
1431 Bungalow Ave Unit 3,4,5 Durham, NC 27703
Bethesda NeighborhoodEstimated Value: $524,000 - $628,000
5
Beds
4
Baths
2,717
Sq Ft
$216/Sq Ft
Est. Value
About This Home
This home is located at 1431 Bungalow Ave Unit 3,4,5, Durham, NC 27703 and is currently estimated at $588,155, approximately $216 per square foot. 1431 Bungalow Ave Unit 3,4,5 is a home located in Durham County with nearby schools including Bethesda Elementary School, John W Neal Middle School, and Southern School of Energy & Sustainability.
Ownership History
Date
Name
Owned For
Owner Type
Purchase Details
Closed on
Jan 14, 2021
Sold by
Laukam Andrew G and Laukam Dafina
Bought by
Knott Marquise
Current Estimated Value
Home Financials for this Owner
Home Financials are based on the most recent Mortgage that was taken out on this home.
Original Mortgage
$440,000
Outstanding Balance
$392,701
Interest Rate
2.71%
Mortgage Type
VA
Estimated Equity
$195,454
Purchase Details
Closed on
Jun 29, 2012
Sold by
Sabha Hisham and Sabha Kholoud
Bought by
Laukam Andrew G
Home Financials for this Owner
Home Financials are based on the most recent Mortgage that was taken out on this home.
Original Mortgage
$235,554
Interest Rate
3.75%
Mortgage Type
FHA
Purchase Details
Closed on
Feb 15, 2012
Sold by
Gemini Homes Of Nc Corp
Bought by
Sabha Hisham
Create a Home Valuation Report for This Property
The Home Valuation Report is an in-depth analysis detailing your home's value as well as a comparison with similar homes in the area
Home Values in the Area
Average Home Value in this Area
Purchase History
| Date | Buyer | Sale Price | Title Company |
|---|---|---|---|
| Knott Marquise | $440,000 | None Available | |
| Laukam Andrew G | $240,000 | None Available | |
| Sabha Hisham | -- | None Available |
Source: Public Records
Mortgage History
| Date | Status | Borrower | Loan Amount |
|---|---|---|---|
| Open | Knott Marquise | $440,000 | |
| Previous Owner | Laukam Andrew G | $235,554 |
Source: Public Records
Tax History Compared to Growth
Tax History
| Year | Tax Paid | Tax Assessment Tax Assessment Total Assessment is a certain percentage of the fair market value that is determined by local assessors to be the total taxable value of land and additions on the property. | Land | Improvement |
|---|---|---|---|---|
| 2025 | $4,112 | $602,002 | $141,750 | $460,252 |
| 2024 | $3,203 | $318,096 | $48,480 | $269,616 |
| 2023 | $3,087 | $318,096 | $48,480 | $269,616 |
| 2022 | $3,003 | $318,096 | $48,480 | $269,616 |
| 2021 | $2,790 | $263,179 | $48,480 | $214,699 |
| 2020 | $2,256 | $263,179 | $48,480 | $214,699 |
| 2019 | $2,229 | $263,179 | $48,480 | $214,699 |
| 2018 | $1,964 | $212,820 | $38,380 | $174,440 |
| 2017 | $1,900 | $212,820 | $38,380 | $174,440 |
| 2016 | $1,842 | $212,820 | $38,380 | $174,440 |
| 2015 | $2,172 | $220,223 | $45,427 | $174,796 |
| 2014 | $2,183 | $220,223 | $45,427 | $174,796 |
Source: Public Records
Map
Nearby Homes
- 1309 Bungalow Ave
- 3857 Angier Ave
- 1716 Stage Rd
- 2221 Mica Ridge Ln
- 2219 Mica Ridge Ln
- 2217 Mica Ridge Ln
- 2215 Mica Ridge Ln
- 2213 Mica Ridge Ln
- Dylan Plan at Mica Ridge - Venture Collection
- Mitchell II Plan at Mica Ridge - Club Collection
- Sutton Plan at Mica Ridge - Venture Collection
- Winstead III Plan at Mica Ridge - Sterling Collection
- Nelson Plan at Mica Ridge - Sterling Collection
- Somerset III Plan at Mica Ridge - Sterling Collection
- 1711 S Miami Blvd
- 3302 Opal Dr
- 3308 Opal Dr
- 4017 Angier Ave
- 1821 S Mineral Springs Rd
- 3463 Delmar Dr
- 1431 Bungalow Ave
- 1427 Bungalow Ave Unit 1
- 1502 Tyonek Dr
- 1433 Bungalow Ave Unit 14
- 1433 Bungalow Ave
- 1423 Bungalow Ave
- 1423 Bungalow Ave Unit 2
- 1500 Tyonek Dr
- 1504 Tyonek Dr
- 1437 Bungalow Ave
- 1437 Bungalow Ave Unit 13
- 4 Featherglen Ct
- 6 Featherglen Ct
- 1506 Tyonek Dr
- 1441 Bungalow Ave
- 2 Featherglen Ct
- 1508 Tyonek Dr
- 1501 Tyonek Dr
- 1445 Bungalow Ave
- 7 Featherglen Ct