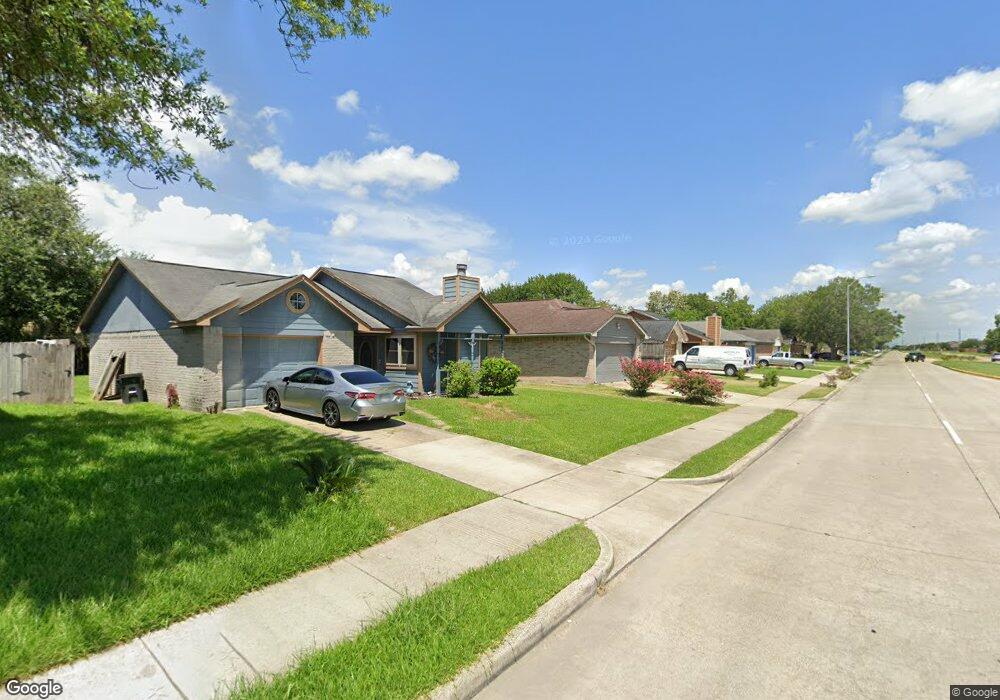
1431 Dell Dale St Channelview, TX 77530
Estimated Value: $179,000 - $196,000
3
Beds
2
Baths
1,099
Sq Ft
$169/Sq Ft
Est. Value
About This Home
This home is located at 1431 Dell Dale St, Channelview, TX 77530 and is currently estimated at $185,852, approximately $169 per square foot. 1431 Dell Dale St is a home located in Harris County with nearby schools including Channelview High School.
Ownership History
Date
Name
Owned For
Owner Type
Purchase Details
Closed on
Mar 1, 2019
Sold by
Castilla Imperium Llc
Bought by
Mujeres En Accion Llc
Current Estimated Value
Home Financials for this Owner
Home Financials are based on the most recent Mortgage that was taken out on this home.
Original Mortgage
$95,000
Outstanding Balance
$72,692
Interest Rate
4.4%
Mortgage Type
New Conventional
Estimated Equity
$113,160
Purchase Details
Closed on
Jan 7, 2019
Sold by
Pennington Catherine
Bought by
Castilla Imperium Llc
Home Financials for this Owner
Home Financials are based on the most recent Mortgage that was taken out on this home.
Original Mortgage
$95,000
Outstanding Balance
$72,692
Interest Rate
4.4%
Mortgage Type
New Conventional
Estimated Equity
$113,160
Purchase Details
Closed on
Apr 10, 2000
Sold by
Pennington Catherine
Bought by
Pennington Catherine and Gardner William L
Purchase Details
Closed on
Sep 7, 1999
Sold by
Garlington J P and Garlington Billie
Bought by
Pennington Catherine
Create a Home Valuation Report for This Property
The Home Valuation Report is an in-depth analysis detailing your home's value as well as a comparison with similar homes in the area
Home Values in the Area
Average Home Value in this Area
Purchase History
| Date | Buyer | Sale Price | Title Company |
|---|---|---|---|
| Mujeres En Accion Llc | -- | None Available | |
| Castilla Imperium Llc | -- | None Available | |
| Pennington Catherine | -- | -- | |
| Pennington Catherine | -- | Texas American Title Company |
Source: Public Records
Mortgage History
| Date | Status | Borrower | Loan Amount |
|---|---|---|---|
| Open | Mujeres En Accion Llc | $95,000 | |
| Previous Owner | Castilla Imperium Llc | $90,000 |
Source: Public Records
Tax History Compared to Growth
Tax History
| Year | Tax Paid | Tax Assessment Tax Assessment Total Assessment is a certain percentage of the fair market value that is determined by local assessors to be the total taxable value of land and additions on the property. | Land | Improvement |
|---|---|---|---|---|
| 2025 | $3,414 | $164,622 | $36,827 | $127,795 |
| 2024 | $3,414 | $167,046 | $36,827 | $130,219 |
| 2023 | $3,414 | $171,718 | $36,827 | $134,891 |
| 2022 | $3,600 | $151,417 | $36,827 | $114,590 |
| 2021 | $3,343 | $132,770 | $36,827 | $95,943 |
| 2020 | $3,224 | $117,149 | $36,827 | $80,322 |
| 2019 | $2,825 | $112,533 | $30,916 | $81,617 |
| 2018 | $0 | $97,569 | $26,333 | $71,236 |
| 2017 | $2,386 | $97,569 | $26,333 | $71,236 |
| 2016 | $2,169 | $91,555 | $19,223 | $72,332 |
| 2015 | $482 | $75,272 | $11,586 | $63,686 |
| 2014 | $482 | $65,110 | $11,586 | $53,524 |
Source: Public Records
Map
Nearby Homes
- 15262 Mincing Ln
- 15307 Streatham Cir
- 1527 Wrotham Ln
- 15318 Streatham Cir
- 15223 Bedford Glen Dr
- 1502 Stevenage Ln
- 15215 Peachmeadow Ln
- 1315 Goswell Ln
- 1330 Stevenage Ln
- 1727 Mickle Creek Dr
- 1231 Nuevo Carrasco Ln
- 15458 Casita Verde Way
- 15451 Refugio Verde Way
- 1130 Fairlane Square
- 1818 Mickle Creek Dr
- 15470 Rancho Joya Way
- 16111 Marcelia Dr
- 1611 Jaquima Valley Way
- 16435 Peyton Ridge Cir
- 16206 Darrian Ln
- 1435 Dell Dale St
- 1427 Dell Dale St
- 1439 Dell Dale St
- 1423 Dell Dale St
- 1418 Wrotham Ln
- 1422 Wrotham Ln
- 1414 Wrotham Ln
- 1426 Wrotham Ln
- 1443 Dell Dale St
- 1419 Dell Dale St
- 1410 Wrotham Ln
- 1430 Wrotham Ln
- 15303 Bedford Glen Dr
- 1447 Dell Dale St
- 1415 Dell Dale St
- 1406 Wrotham Ln
- 1411 Londongreen Dr
- 1434 Wrotham Ln
- 1411 Dell Dale St
- 1451 Dell Dale St