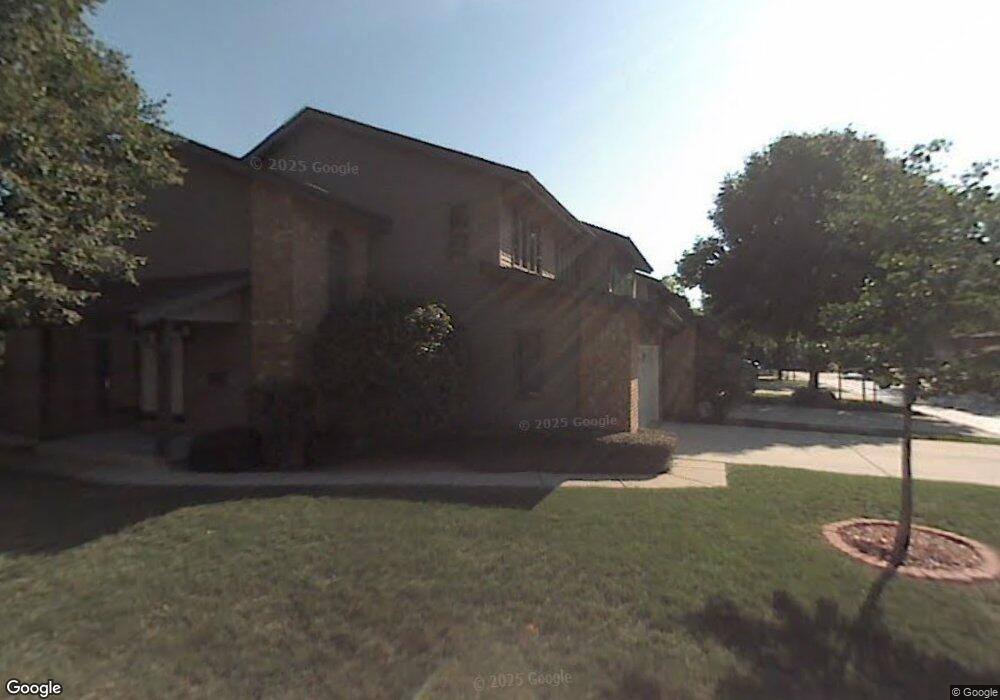
1431 N Picadilly Cir Mount Prospect, IL 60056
North Mount Prospect NeighborhoodEstimated Value: $371,000 - $420,000
3
Beds
3
Baths
1,670
Sq Ft
$236/Sq Ft
Est. Value
About This Home
This home is located at 1431 N Picadilly Cir, Mount Prospect, IL 60056 and is currently estimated at $394,299, approximately $236 per square foot. 1431 N Picadilly Cir is a home located in Cook County with nearby schools including Dwight D Eisenhower Elementary School, Anne Sullivan Elementary School, and Betsy Ross Elementary School.
Ownership History
Date
Name
Owned For
Owner Type
Purchase Details
Closed on
Dec 18, 2024
Sold by
Donovan Dawn M
Bought by
Lapetino Emily A
Current Estimated Value
Home Financials for this Owner
Home Financials are based on the most recent Mortgage that was taken out on this home.
Original Mortgage
$368,207
Outstanding Balance
$364,192
Interest Rate
6.63%
Mortgage Type
FHA
Estimated Equity
$30,107
Purchase Details
Closed on
Nov 12, 2021
Sold by
Keene Janine
Bought by
Donovan Dawn M
Home Financials for this Owner
Home Financials are based on the most recent Mortgage that was taken out on this home.
Original Mortgage
$263,700
Interest Rate
3.12%
Mortgage Type
New Conventional
Purchase Details
Closed on
Mar 5, 1996
Sold by
Chae Kyung Duk and Chae Julie
Bought by
Culhane Edward A and Culhane Patricia A
Home Financials for this Owner
Home Financials are based on the most recent Mortgage that was taken out on this home.
Original Mortgage
$182,800
Interest Rate
6.75%
Create a Home Valuation Report for This Property
The Home Valuation Report is an in-depth analysis detailing your home's value as well as a comparison with similar homes in the area
Home Values in the Area
Average Home Value in this Area
Purchase History
| Date | Buyer | Sale Price | Title Company |
|---|---|---|---|
| Lapetino Emily A | $375,000 | None Listed On Document | |
| Donovan Dawn M | $293,000 | Chicago Title | |
| Culhane Edward A | $192,500 | Attorneys Natl Title Network |
Source: Public Records
Mortgage History
| Date | Status | Borrower | Loan Amount |
|---|---|---|---|
| Open | Lapetino Emily A | $368,207 | |
| Previous Owner | Donovan Dawn M | $263,700 | |
| Previous Owner | Culhane Edward A | $182,800 |
Source: Public Records
Tax History
| Year | Tax Paid | Tax Assessment Tax Assessment Total Assessment is a certain percentage of the fair market value that is determined by local assessors to be the total taxable value of land and additions on the property. | Land | Improvement |
|---|---|---|---|---|
| 2025 | $7,515 | $36,000 | $4,986 | $31,014 |
| 2024 | $7,515 | $30,000 | $4,500 | $25,500 |
| 2023 | $7,186 | $30,000 | $4,500 | $25,500 |
| 2022 | $7,186 | $30,000 | $4,500 | $25,500 |
| 2021 | $5,483 | $20,764 | $3,926 | $16,838 |
| 2020 | $5,415 | $20,764 | $3,926 | $16,838 |
| 2019 | $5,433 | $23,226 | $3,926 | $19,300 |
| 2018 | $6,684 | $25,541 | $3,427 | $22,114 |
| 2017 | $6,738 | $25,541 | $3,427 | $22,114 |
| 2016 | $6,560 | $25,541 | $3,427 | $22,114 |
| 2015 | $4,293 | $16,265 | $2,991 | $13,274 |
| 2014 | $4,243 | $16,265 | $2,991 | $13,274 |
| 2013 | $4,865 | $18,729 | $2,991 | $15,738 |
Source: Public Records
Map
Nearby Homes
- 250 W Parliament Place Unit 301
- 101 W Brighton Place Unit T9
- 105 W Dover Dr Unit T3
- 1414 N Bridgeport Dr Unit T31
- 1454 N Elmhurst Rd Unit 102B
- 101 N Schoenbeck Rd
- 740 Creekside Dr Unit 510D
- 730 Creekside Dr Unit 209C
- 730 Creekside Dr Unit 405C
- 1404 Plum Ct Unit C
- 1401 Plum Ct Unit D
- 710 Creekside Dr Unit 310A
- 710 Creekside Dr Unit 104A
- 710 Creekside Dr Unit 110A
- 901 Butternut Ln Unit A
- 100 Hawthorne Place
- 206 Elm St
- 1001 Butternut Ln Unit C
- 214 N Elmhurst Rd
- 206 E Camp Mcdonald Rd
- 1431 Picadilly Ct Unit 1431
- 1433 N Picadilly Cir
- 1433 N Picadilly Cir Unit 1433
- 1429 Picadilly Ct
- 1435 N Picadilly Cir
- 1427 N Picadilly Cir
- 1425 Picadilly Ct
- 1437 N Picadilly Cir
- 1439 N Picadilly Cir
- 1441 N Picadilly Cir
- 1415 Picadilly Ct
- 1415 N Picadilly Cir
- 1413 N Picadilly Cir
- 1443 N Picadilly Cir
- 210 W Hanover Place Unit T92
- 1417 N Picadilly Cir
- 212 W Hanover Place Unit T91
- 1445 N Picadilly Cir
- 1419 Picadilly Ct
- 1419 N Picadilly Cir
Your Personal Tour Guide
Ask me questions while you tour the home.