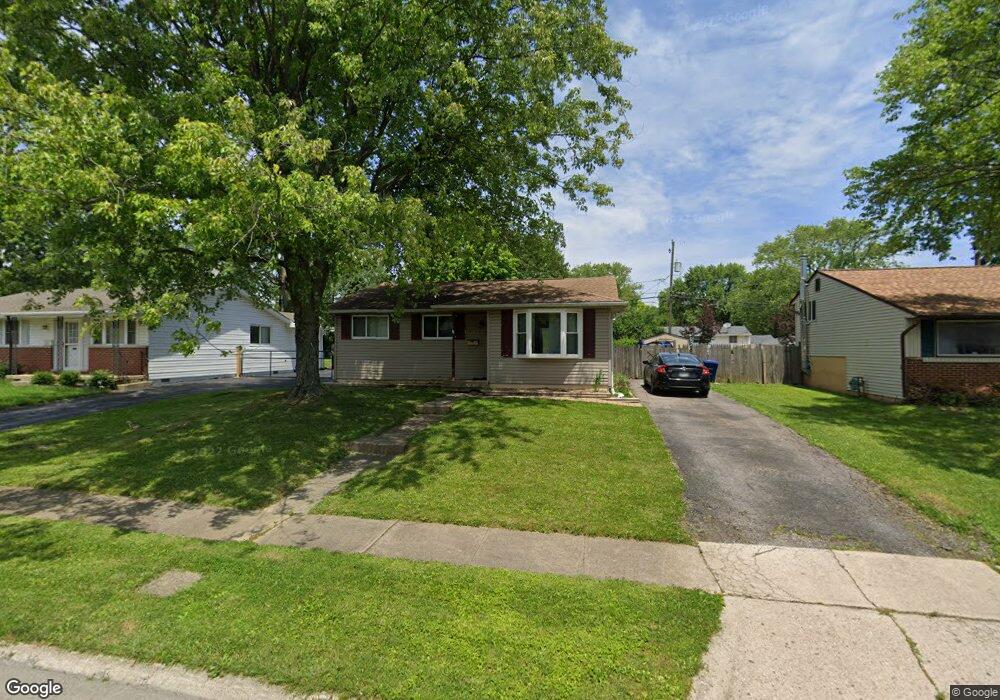
1432 Chesterton Square N Columbus, OH 43229
Devonshire NeighborhoodEstimated Value: $228,000 - $230,000
3
Beds
2
Baths
944
Sq Ft
$242/Sq Ft
Est. Value
About This Home
This home is located at 1432 Chesterton Square N, Columbus, OH 43229 and is currently estimated at $228,647, approximately $242 per square foot. 1432 Chesterton Square N is a home located in Franklin County with nearby schools including Devonshire Alternative Elementary School, Woodward Park Middle School, and Beechcroft High School.
Ownership History
Date
Name
Owned For
Owner Type
Purchase Details
Closed on
Aug 24, 2017
Sold by
Shannon Robert M
Bought by
Shannon Robert J
Current Estimated Value
Purchase Details
Closed on
Dec 15, 2008
Sold by
Secretary Of Housing & Urban Development
Bought by
Shannon Robert J and Shannon Robert M
Purchase Details
Closed on
Dec 14, 2007
Sold by
Hale Larry Edgar and Us Bank Na
Bought by
Hud
Purchase Details
Closed on
Jan 1, 2002
Sold by
Hale Larry Edgar
Bought by
Hale Larry Edgar
Purchase Details
Closed on
Jun 8, 1989
Bought by
Giammarco Margaret A
Purchase Details
Closed on
Aug 1, 1978
Create a Home Valuation Report for This Property
The Home Valuation Report is an in-depth analysis detailing your home's value as well as a comparison with similar homes in the area
Home Values in the Area
Average Home Value in this Area
Purchase History
| Date | Buyer | Sale Price | Title Company |
|---|---|---|---|
| Shannon Robert J | -- | None Available | |
| Shannon Robert J | $33,050 | Worthington | |
| Hud | -- | None Available | |
| Hale Larry Edgar | -- | -- | |
| Giammarco Margaret A | $59,000 | -- | |
| -- | $34,000 | -- |
Source: Public Records
Tax History Compared to Growth
Tax History
| Year | Tax Paid | Tax Assessment Tax Assessment Total Assessment is a certain percentage of the fair market value that is determined by local assessors to be the total taxable value of land and additions on the property. | Land | Improvement |
|---|---|---|---|---|
| 2024 | $2,967 | $66,120 | $17,500 | $48,620 |
| 2023 | $2,930 | $66,115 | $17,500 | $48,615 |
| 2022 | $2,011 | $38,780 | $12,600 | $26,180 |
| 2021 | $2,015 | $38,780 | $12,600 | $26,180 |
| 2020 | $2,018 | $38,780 | $12,600 | $26,180 |
| 2019 | $1,858 | $30,630 | $10,080 | $20,550 |
| 2018 | $1,541 | $30,630 | $10,080 | $20,550 |
| 2017 | $1,857 | $30,630 | $10,080 | $20,550 |
| 2016 | $1,693 | $25,560 | $7,670 | $17,890 |
| 2015 | $1,382 | $25,560 | $7,670 | $17,890 |
| 2014 | $1,541 | $25,560 | $7,670 | $17,890 |
| 2013 | $868 | $28,385 | $8,505 | $19,880 |
Source: Public Records
Map
Nearby Homes
- 5990 Ambleside Dr
- 1390 E Dublin Granville Rd
- 6035 Karl Rd
- 1288 Oakfield Dr N
- 1549 Alpine Dr
- 1171 Newbury Dr
- 6189 Northgap Dr
- 6211 Parkdale Dr
- 1492 Cottonwood Dr
- 1752 Pine Tree St S Unit H
- 1743 Pine Tree St N Unit A
- 1687 Brookfield Square S
- 1268 Kildale Ct
- 6342 Bellmeadow Dr
- 6407 Faircrest Rd
- 6458 Faircrest Rd
- 1722 Blue Ash Place
- 6019 Beechcroft Rd
- 1409 Bosworth Place
- 1421 Bosworth Place
- 1424 Chesterton Square N
- 1450 Chesterton Square N
- 1416 Chesterton Square N
- 1431 Burnley Square S
- 1425 Burnley Square S
- 1451 Burnley Square S
- 1431 Chesterton Square N
- 1417 Burnley Square S
- 1423 Chesterton Square N
- 1456 Chesterton Square N
- 1408 Chesterton Square N
- 1445 Chesterton Square N
- 1415 Chesterton Square N
- 1457 Burnley Square S
- 1451 Chesterton Square N
- 1411 Burnley Square S
- 1400 Chesterton Square N
- 1464 Chesterton Square N
- 1407 Chesterton Square N
- 1457 Chesterton Square N