NOT LISTED FOR SALE

1432 Lander Ln Lafayette, CO 80026

Estimated Value: $1,004,000 - $1,108,000

4 Beds
4 Baths
3,754 Sq Ft
$280/Sq Ft Est. Value

Last Sold December 29, 2014

Last sale price $539,990 $144 Per Sq Ft

Est. 95% increase in value since last sale

Current estimated payment $6,032/month

About This Home

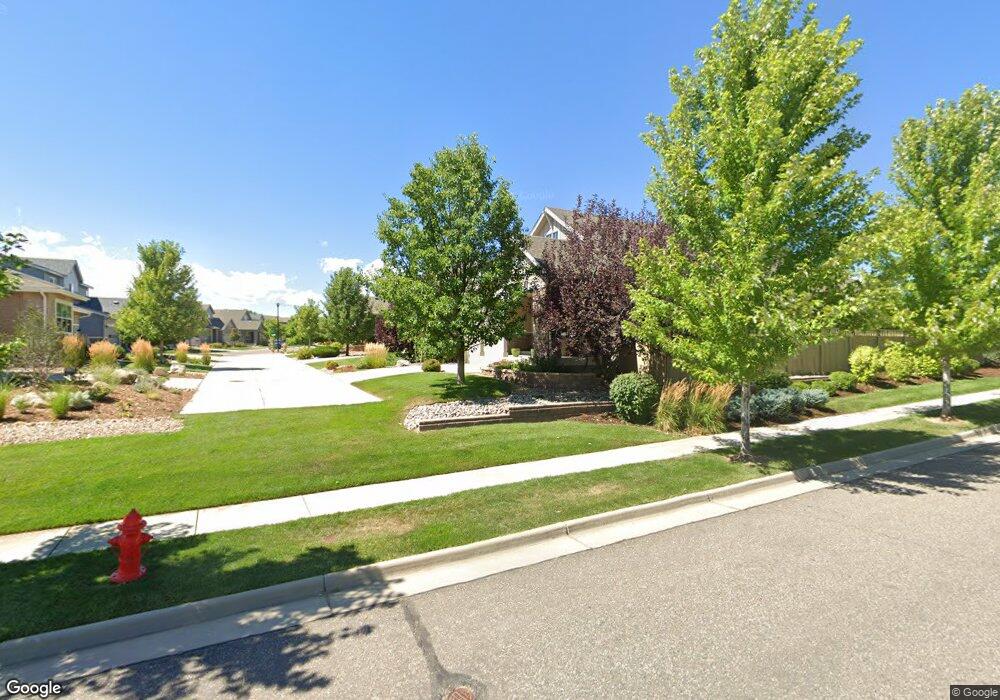
Ready Now! MODEL HOME features exciting multi-gen living with main floor guest suite with bedrm, bath, sitting room. Gourmet kit dbl ovens, SS appliances, walk-in pantry, extensive hardwood, upgraded cabinets, carpet and tile, pro finished basement w rec room, wet bar, bedrm and bath. Custom built ins, Fully landscaped and fenced, quiet setting backing green belt, cul-de-sac. Don't miss this great value in Boulder County!

Ownership History

Date Name Owned For Owner Type

Purchase Details

Listed on
Oct 3, 2014
Closed on
Dec 23, 2014
Sold by
The Ryland Group Inc
Bought by
Murari Harsh
Seller's Agent
Metro Brokers Team Lassen
MB/Team Lassen
Buyer's Agent
Non-IRES Agent
Non-IRES
List Price
$639,900
Sold Price
$539,990
Premium/Discount to List
-$99,910
-15.61%
Current Estimated Value
$1,051,027

Home Financials for this Owner

Home Financials are based on the most recent Mortgage that was taken out on this home.
Estimated Appreciation
$511,037
Avg. Annual Appreciation
6.34%
Original Mortgage
$417,000
Outstanding Balance
$234,228
Interest Rate
4.01%
Mortgage Type
New Conventional
Estimated Equity
$816,799
Source: Public Records

Range of Values:

Collateral Analytics

Collateral Analytics Collateral Analytics AVMs (Automated Valuation Model) employ a number of statistical approaches combined with neighborhood-specific comparable selection guarantees the most up-to-date and precise valuations.

Not Available

Collateral Analytics does not have data for the current month. Please view the chart for historical values.

ICE

ICE Mortgage Technology ICE Mortgage Technology’s AVM (Automated Valuation Model) is a state-of-the-art online residential property valuation tool that provides a quick and accurate estimate of the value of almost any home in the U.S.

Not Available

ICE Mortgage Technology does not have data for the current month. Please view the chart for historical values.

First American

First American First American Data & Analytics’ next-generation AVM combines unrivaled data assets with a blended ensemble of valuation models to produce highly accurate, reliable valuations you can trust.

Not Available

First American does not have data for the current month. Please view the chart for historical values.

Quantarium

Quantarium Quantarium’s valuation service, repeatedly proven the industry’s most accurate and comprehensive, is supercharged with a self-learning and auto-tuning AI engine that continually becomes smarter and more accurate as it processes daily inputs from the industry’s leading RE data lake.

Not Available

Quantarium does not have data for the current month. Please view the chart for historical values.

Average Value
Not Available
List Price
Sold Price
Create a Home Valuation Report for This Property
The Home Valuation Report is an in-depth analysis detailing your home's value as well as a comparison with similar homes in the area

Home Values in the Area

Source: Public Records

Average Home Value in this Area


Source: Public Records

Purchase History

Date Buyer Sale Price Title Company
Murari Harsh $539,250 Ryland Title
Source: Public Records

Mortgage History

Date Status Borrower Loan Amount
Open Murari Harsh $417,000
Source: Public Records

Property History

Date Event Price List to Sale Price per Sq Ft Prior Sale
05/03/2020 05/03/20 Off Market $539,990 -- --
12/29/2014 12/29/14 Sold $539,990 -15.6% $144 / Sq Ft View Prior Sale
11/29/2014 11/29/14 Pending -- -- --
10/03/2014 10/03/14 For Sale $639,900 -- $170 / Sq Ft

Tax History Compared to Growth

Source: Public Records

Tax History

Year Tax Paid Tax Assessment Tax Assessment Total Assessment is a certain percentage of the fair market value that is determined by local assessors to be the total taxable value of land and additions on the property. Land Improvement
2025 $5,946 $64,288 $11,344 $52,944
2024 $5,946 $64,288 $11,344 $52,944
2023 $5,844 $67,101 $14,532 $56,253
2022 $4,886 $52,020 $10,223 $41,797
2021 $4,833 $53,518 $10,518 $43,000
2020 $4,362 $47,726 $9,009 $38,717
2019 $4,302 $47,726 $9,009 $38,717
2018 $4,185 $45,842 $7,704 $38,138
2017 $4,075 $50,681 $8,517 $42,164
2016 $3,831 $41,726 $8,358 $33,368
2015 $3,590 $34,387 $7,960 $26,427
2014 $1,118 $12,934 $12,934 $0
Source: Public Records

Agents Affiliated with this Home

See All Agents

Map