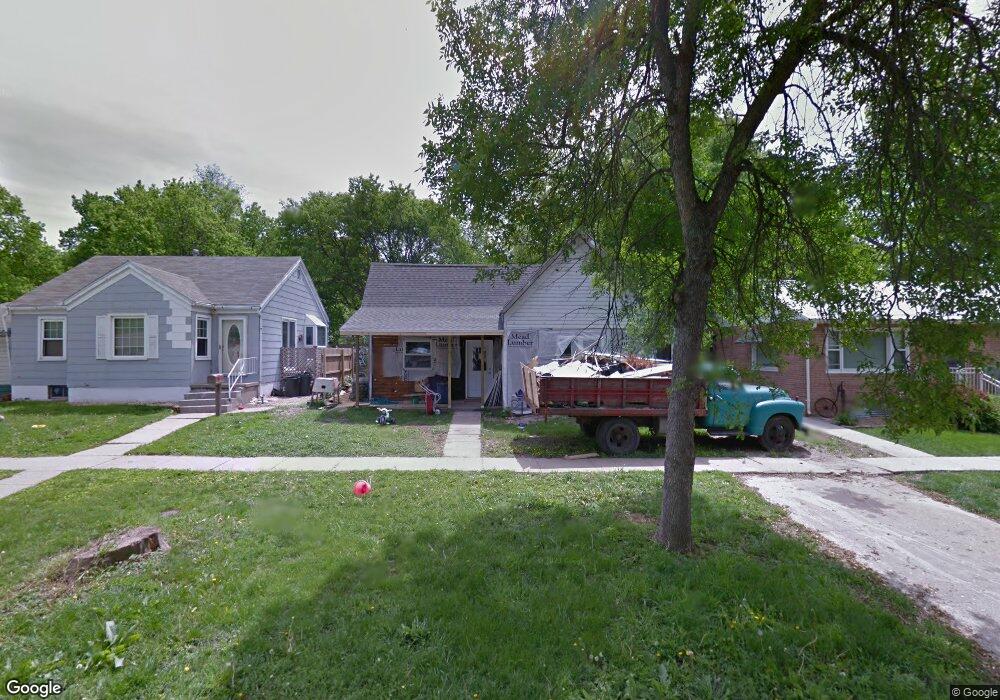
1432 S F St Broken Bow, NE 68822
Estimated Value: $97,684 - $125,000
--
Bed
--
Bath
1,072
Sq Ft
$99/Sq Ft
Est. Value
About This Home
This home is located at 1432 S F St, Broken Bow, NE 68822 and is currently estimated at $106,171, approximately $99 per square foot. 1432 S F St is a home located in Custer County with nearby schools including North Park Elementary School, Broken Bow Junior High School, and Broken Bow High School.
Ownership History
Date
Name
Owned For
Owner Type
Purchase Details
Closed on
Aug 23, 2013
Sold by
Sloggett Kent E and Sloggett Wendy A
Bought by
Renwick Kerston
Current Estimated Value
Purchase Details
Closed on
Nov 29, 2012
Sold by
Sloggett Kent and Sloggett Wendy
Bought by
Sloggett Kent E and Sloggett
Purchase Details
Closed on
Apr 25, 2011
Sold by
Staab Robert K and Staab Kathy
Bought by
Sloggett Kent and Sloggett Wendy
Purchase Details
Closed on
Apr 28, 2008
Sold by
Sands Larry Wade
Bought by
Staab Robert K and Staab Kathy
Create a Home Valuation Report for This Property
The Home Valuation Report is an in-depth analysis detailing your home's value as well as a comparison with similar homes in the area
Home Values in the Area
Average Home Value in this Area
Purchase History
| Date | Buyer | Sale Price | Title Company |
|---|---|---|---|
| Renwick Kerston | $45,000 | -- | |
| Sloggett Kent E | -- | -- | |
| Sloggett Kent | $5,000 | -- | |
| Staab Robert K | $5,000 | -- | |
| Staab Robert K | $2,400 | -- |
Source: Public Records
Tax History Compared to Growth
Tax History
| Year | Tax Paid | Tax Assessment Tax Assessment Total Assessment is a certain percentage of the fair market value that is determined by local assessors to be the total taxable value of land and additions on the property. | Land | Improvement |
|---|---|---|---|---|
| 2025 | $855 | $82,468 | $6,600 | $75,868 |
| 2024 | $855 | $62,568 | $6,600 | $55,968 |
| 2023 | $896 | $57,227 | $6,600 | $50,627 |
| 2022 | $886 | $48,279 | $6,600 | $41,679 |
| 2021 | $855 | $47,679 | $6,000 | $41,679 |
| 2020 | $848 | $47,679 | $6,000 | $41,679 |
| 2019 | $889 | $50,063 | $4,500 | $45,563 |
| 2017 | $844 | $46,211 | $4,500 | $41,711 |
| 2016 | $892 | $44,651 | $2,940 | $41,711 |
| 2015 | $983 | $48,786 | $2,904 | $45,882 |
| 2014 | $983 | $44,351 | $2,640 | $41,711 |
Source: Public Records
Map
Nearby Homes