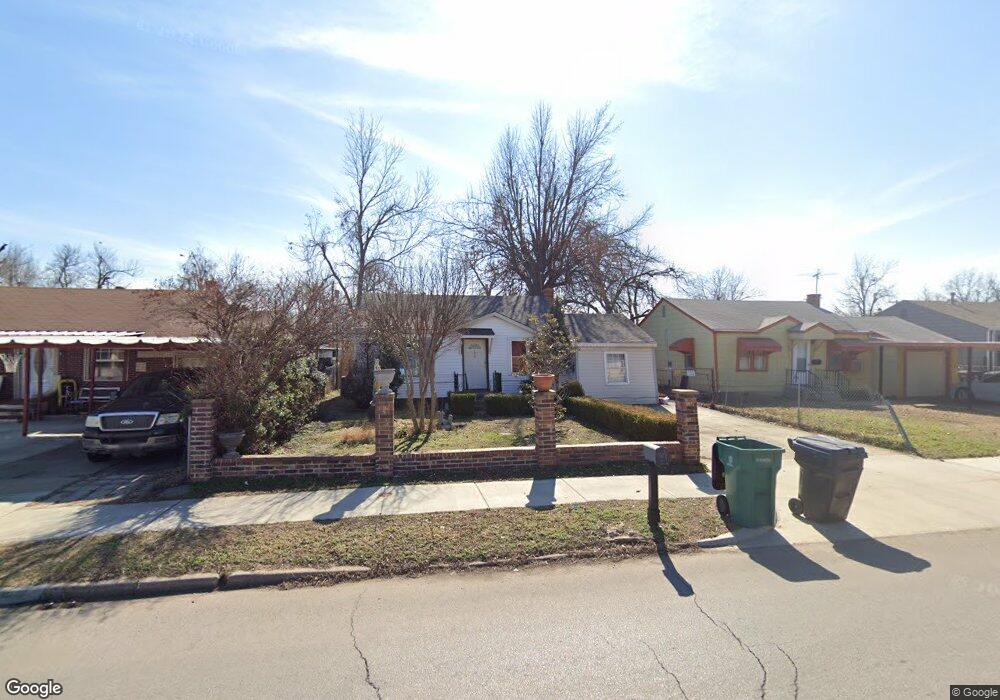
1432 SW 22nd St Oklahoma City, OK 73108
Airpark NeighborhoodEstimated Value: $75,000 - $97,000
2
Beds
1
Bath
784
Sq Ft
$114/Sq Ft
Est. Value
About This Home
This home is located at 1432 SW 22nd St, Oklahoma City, OK 73108 and is currently estimated at $89,446, approximately $114 per square foot. 1432 SW 22nd St is a home located in Oklahoma County with nearby schools including Heronville Elementary School, Capitol Hill Middle School, and Capitol Hill High School.
Ownership History
Date
Name
Owned For
Owner Type
Purchase Details
Closed on
Oct 4, 2017
Sold by
Micaela Garcia Benjamin Hernandez
Bought by
Kds Enterprises Llc
Current Estimated Value
Purchase Details
Closed on
Mar 11, 2006
Sold by
Rak Investments Inc
Bought by
Hernandez Benjamin and Garcia Micaela
Home Financials for this Owner
Home Financials are based on the most recent Mortgage that was taken out on this home.
Original Mortgage
$38,000
Interest Rate
6.09%
Mortgage Type
Seller Take Back
Purchase Details
Closed on
Dec 22, 2005
Sold by
Sanchez Jose Anjel
Bought by
Rak Investments Inc
Purchase Details
Closed on
Dec 15, 2005
Sold by
Barron Armando
Bought by
Sanchez Jose Anjel
Purchase Details
Closed on
Aug 2, 2005
Sold by
Sanchez Dora E
Bought by
Sanchez Jose Anjel and Barron Armando
Purchase Details
Closed on
May 25, 2005
Sold by
Sanchez Jose Amparo
Bought by
Sanchez Dora Elia
Purchase Details
Closed on
Jun 22, 2001
Sold by
Rios Martha L
Bought by
Sanchez Dora E
Create a Home Valuation Report for This Property
The Home Valuation Report is an in-depth analysis detailing your home's value as well as a comparison with similar homes in the area
Home Values in the Area
Average Home Value in this Area
Purchase History
| Date | Buyer | Sale Price | Title Company |
|---|---|---|---|
| Kds Enterprises Llc | -- | None Available | |
| Hernandez Benjamin | $44,000 | None Available | |
| Rak Investments Inc | $37,000 | -- | |
| Sanchez Jose Anjel | -- | -- | |
| Rak Investments Inc | -- | -- | |
| Sanchez Jose Anjel | -- | -- | |
| Sanchez Dora Elia | -- | -- | |
| Sanchez Dora E | -- | -- |
Source: Public Records
Mortgage History
| Date | Status | Borrower | Loan Amount |
|---|---|---|---|
| Previous Owner | Hernandez Benjamin | $38,000 |
Source: Public Records
Tax History Compared to Growth
Tax History
| Year | Tax Paid | Tax Assessment Tax Assessment Total Assessment is a certain percentage of the fair market value that is determined by local assessors to be the total taxable value of land and additions on the property. | Land | Improvement |
|---|---|---|---|---|
| 2024 | $588 | $5,214 | $867 | $4,347 |
| 2023 | $588 | $4,965 | $1,040 | $3,925 |
| 2022 | $533 | $4,729 | $1,198 | $3,531 |
| 2021 | $506 | $4,504 | $732 | $3,772 |
| 2020 | $486 | $4,290 | $777 | $3,513 |
| 2019 | $478 | $4,235 | $777 | $3,458 |
| 2018 | $479 | $4,235 | $0 | $0 |
| 2017 | $479 | $4,234 | $777 | $3,457 |
| 2016 | $467 | $4,124 | $777 | $3,347 |
| 2015 | $459 | $4,013 | $777 | $3,236 |
| 2014 | $464 | $4,087 | $777 | $3,310 |
Source: Public Records
Map
Nearby Homes
- 1212 SW 22nd St
- 1700 SW 18th St
- 2108 SW 25th St
- 2136 SW 23rd St
- 1121 SW 24th St
- 1141 SW 26th St
- 1217 SW 18th St
- 1126 SW 19th St
- 2708 S Mckinley Ave
- 1721 SW 16th St
- 1127 SW 17th St
- 2236 SW 22nd St
- 1044 SW 26th St
- 1904 Oso Ave
- 1743 Oso Ave
- 2245 SW 19th St
- 1721 Oso Ave
- 2220 SW 28th St
- 1052 SW 16th St
- 1637 Pioneer St
- 1428 SW 22nd St
- 1436 SW 22nd St
- 1424 SW 22nd St
- 1440 SW 22nd St
- 1420 SW 22nd St
- 1433 SW 23rd St
- 1437 SW 23rd St
- 1429 SW 23rd St
- 1441 SW 23rd St
- 1425 SW 23rd St
- 1416 SW 22nd St
- 1445 SW 23rd St
- 1421 SW 23rd St
- 1412 SW 22nd St
- 1417 SW 23rd St
- 2316 S Kentucky Ave
- 1413 SW 23rd St
- 1408 SW 22nd St
- 1501 SW 23rd St
- 1409 SW 23rd St