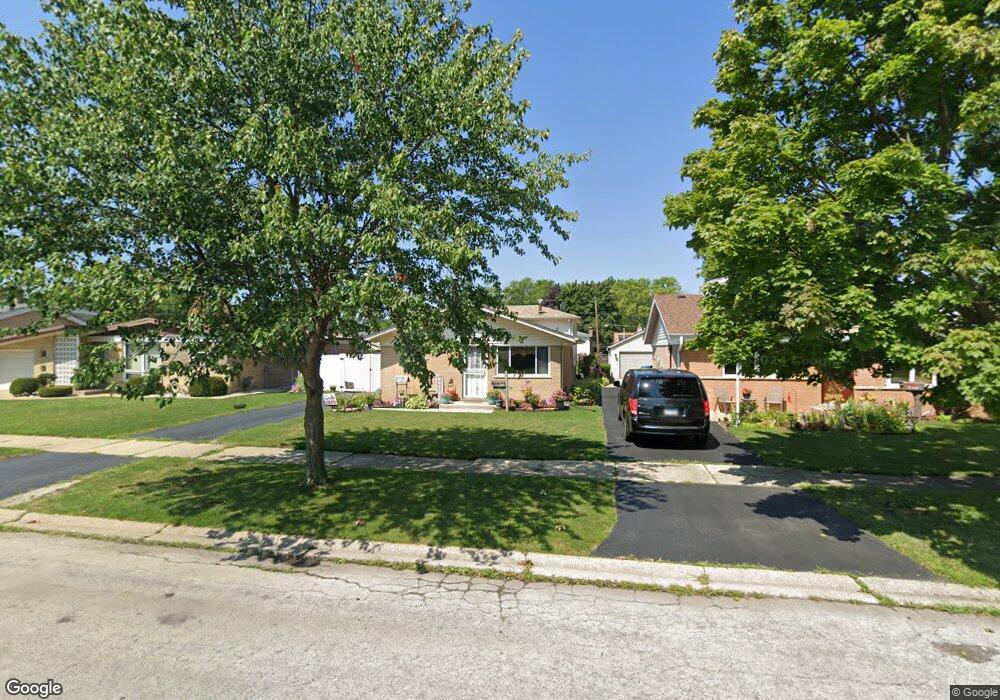
14322 Karlov Ave Midlothian, IL 60445
Estimated Value: $194,000 - $249,000
3
Beds
1
Bath
960
Sq Ft
$239/Sq Ft
Est. Value
About This Home
This home is located at 14322 Karlov Ave, Midlothian, IL 60445 and is currently estimated at $229,716, approximately $239 per square foot. 14322 Karlov Ave is a home located in Cook County with nearby schools including Springfield Elementary School, Bremen High School, and St. Christopher School.
Ownership History
Date
Name
Owned For
Owner Type
Purchase Details
Closed on
Apr 23, 2003
Sold by
Washington Mutual Bank Fa
Bought by
Conway John and Conway Jennifer
Current Estimated Value
Home Financials for this Owner
Home Financials are based on the most recent Mortgage that was taken out on this home.
Original Mortgage
$123,400
Outstanding Balance
$53,479
Interest Rate
5.87%
Mortgage Type
Unknown
Estimated Equity
$176,237
Purchase Details
Closed on
Feb 10, 2003
Sold by
Tranmer Joseph P
Bought by
Washington Mutual Bank Fa
Purchase Details
Closed on
Dec 19, 1995
Sold by
Moravek Barbara J and Craig John E
Bought by
Tranmer Joseph P and Tranmer Kristi L
Home Financials for this Owner
Home Financials are based on the most recent Mortgage that was taken out on this home.
Original Mortgage
$86,400
Interest Rate
7.05%
Create a Home Valuation Report for This Property
The Home Valuation Report is an in-depth analysis detailing your home's value as well as a comparison with similar homes in the area
Home Values in the Area
Average Home Value in this Area
Purchase History
| Date | Buyer | Sale Price | Title Company |
|---|---|---|---|
| Conway John | $130,000 | Multiple | |
| Conway John | $130,000 | Multiple | |
| Washington Mutual Bank Fa | -- | -- | |
| Tranmer Joseph P | $108,000 | Attorneys Title Guaranty Fun |
Source: Public Records
Mortgage History
| Date | Status | Borrower | Loan Amount |
|---|---|---|---|
| Open | Conway John | $123,400 | |
| Closed | Conway John | $123,400 | |
| Previous Owner | Tranmer Joseph P | $86,400 |
Source: Public Records
Tax History Compared to Growth
Tax History
| Year | Tax Paid | Tax Assessment Tax Assessment Total Assessment is a certain percentage of the fair market value that is determined by local assessors to be the total taxable value of land and additions on the property. | Land | Improvement |
|---|---|---|---|---|
| 2024 | $5,557 | $18,000 | $2,680 | $15,320 |
| 2023 | $5,127 | $18,000 | $2,680 | $15,320 |
| 2022 | $5,127 | $14,332 | $2,345 | $11,987 |
| 2021 | $4,969 | $14,332 | $2,345 | $11,987 |
| 2020 | $4,831 | $14,332 | $2,345 | $11,987 |
| 2019 | $4,946 | $14,818 | $2,177 | $12,641 |
| 2018 | $4,866 | $14,818 | $2,177 | $12,641 |
| 2017 | $4,714 | $14,818 | $2,177 | $12,641 |
| 2016 | $4,482 | $12,943 | $1,842 | $11,101 |
| 2015 | $4,329 | $12,943 | $1,842 | $11,101 |
| 2014 | $4,224 | $12,943 | $1,842 | $11,101 |
| 2013 | $4,270 | $14,302 | $1,842 | $12,460 |
Source: Public Records
Map
Nearby Homes
- 14401 Pulaski Rd
- 14431 Tripp Ave
- 14501 Keystone Ave Unit 8
- 14501 Tripp Ave
- 14145 Kedvale Ave Unit 3
- 14401 Kolin Ave
- 14224 Springfield Ave
- 14539 Crawford Ave
- 14601 Keystone Ave Unit B3
- 14601 Tripp Ave
- 14618 Keystone Ave
- 14244 Kostner Ave
- 4031 147th St
- 14544 Kostner Ave
- 14328 Lawndale Ave
- 14507 Ridgeway Ave
- 14632 Kostner Ave
- 3745 W 140th St
- 3743 W 140th St
- 3738 W 141st St
- 14324 Karlov Ave
- 14314 Karlov Ave
- 14328 Karlov Ave
- 14306 Karlov Ave
- 14325 Kedvale Ave
- 14315 Kedvale Ave
- 14334 Karlov Ave
- 14304 Karlov Ave
- 14329 Kedvale Ave
- 14311 Kedvale Ave
- 14344 Karlov Ave
- 14335 Kedvale Ave
- 14319 Karlov Ave
- 14300 Karlov Ave
- 14307 Kedvale Ave
- 14315 Karlov Ave
- 14325 Karlov Ave
- 14311 Karlov Ave
- 14329 Karlov Ave
- 14339 Kedvale Ave