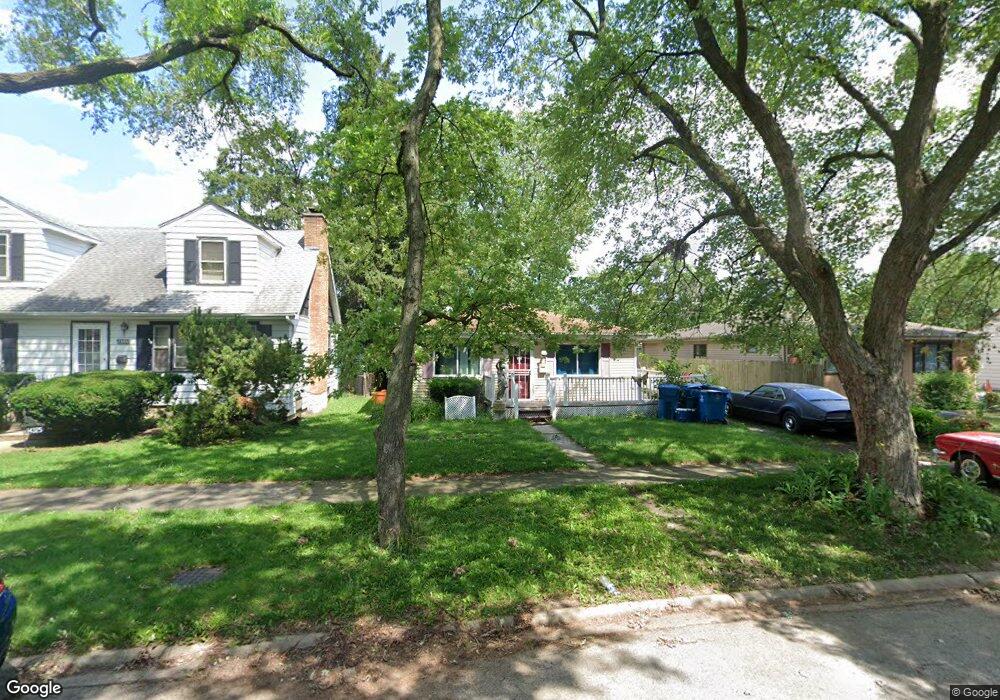
14327 Millard Ave Midlothian, IL 60445
Estimated Value: $161,000 - $210,000
4
Beds
1
Bath
1,247
Sq Ft
$156/Sq Ft
Est. Value
About This Home
This home is located at 14327 Millard Ave, Midlothian, IL 60445 and is currently estimated at $193,971, approximately $155 per square foot. 14327 Millard Ave is a home located in Cook County with nearby schools including Springfield Elementary School, Bremen High School, and St. Christopher School.
Ownership History
Date
Name
Owned For
Owner Type
Purchase Details
Closed on
May 20, 2020
Sold by
Barragan Gloria
Bought by
Barragan Gloria and Gloria Barragan Revocable Trus
Current Estimated Value
Purchase Details
Closed on
Jul 21, 2009
Sold by
Us Bank National Association
Bought by
Barragan Gloria
Home Financials for this Owner
Home Financials are based on the most recent Mortgage that was taken out on this home.
Original Mortgage
$54,985
Interest Rate
5.19%
Mortgage Type
FHA
Purchase Details
Closed on
Apr 30, 2009
Sold by
Collins Matthew S
Bought by
Us Bank National Association
Purchase Details
Closed on
Oct 4, 2005
Sold by
Bellecomo Alphonso L and Bellecomo Bonnie J
Bought by
Collins Matthew S
Home Financials for this Owner
Home Financials are based on the most recent Mortgage that was taken out on this home.
Original Mortgage
$138,600
Interest Rate
7.4%
Mortgage Type
Unknown
Create a Home Valuation Report for This Property
The Home Valuation Report is an in-depth analysis detailing your home's value as well as a comparison with similar homes in the area
Home Values in the Area
Average Home Value in this Area
Purchase History
| Date | Buyer | Sale Price | Title Company |
|---|---|---|---|
| Barragan Gloria | -- | Attorney | |
| Barragan Gloria | $53,000 | Attorneys Title Guaranty Fun | |
| Us Bank National Association | -- | None Available | |
| Collins Matthew S | $154,000 | Multiple |
Source: Public Records
Mortgage History
| Date | Status | Borrower | Loan Amount |
|---|---|---|---|
| Previous Owner | Barragan Gloria | $54,985 | |
| Previous Owner | Collins Matthew S | $138,600 |
Source: Public Records
Tax History Compared to Growth
Tax History
| Year | Tax Paid | Tax Assessment Tax Assessment Total Assessment is a certain percentage of the fair market value that is determined by local assessors to be the total taxable value of land and additions on the property. | Land | Improvement |
|---|---|---|---|---|
| 2024 | $3,414 | $13,001 | $2,328 | $10,673 |
| 2023 | $3,726 | $13,001 | $2,328 | $10,673 |
| 2022 | $3,726 | $12,035 | $1,995 | $10,040 |
| 2021 | $3,631 | $12,035 | $1,995 | $10,040 |
| 2020 | $3,576 | $12,035 | $1,995 | $10,040 |
| 2019 | $3,269 | $11,642 | $1,828 | $9,814 |
| 2018 | $3,214 | $11,642 | $1,828 | $9,814 |
| 2017 | $3,128 | $11,642 | $1,828 | $9,814 |
| 2016 | $2,986 | $9,456 | $1,662 | $7,794 |
| 2015 | $2,866 | $9,456 | $1,662 | $7,794 |
| 2014 | $3,366 | $10,837 | $1,662 | $9,175 |
| 2013 | $2,519 | $10,266 | $1,662 | $8,604 |
Source: Public Records
Map
Nearby Homes
- 14328 Lawndale Ave
- 3616 Maxey Ct
- 14503 Waverly Ave
- 14517 Saint Louis Ave
- 3223 Emery Ln
- 14301 Hamlin Ave
- 3101 Emery Ln
- 14104 S Claire Blvd
- 14044 S Grace Ave
- 14039 S Claire Blvd
- 3214 W Lydia Ave
- 3738 W 141st St
- 3902 Claire Blvd
- 3546 147th St
- 14542 Turner Ave
- 3625 147th St
- 3631 147th St
- 3743 W 140th St
- 3210 Mcbreen Ave
- 3745 W 140th St
- 14331 Millard Ave
- 14325 Millard Ave
- 14335 Millard Ave
- 14320 Central Park Ave
- 14324 Central Park Ave
- 14333 Millard Ave
- 14330 Central Park Ave
- 14326 Millard Ave
- 14345 Millard Ave
- 14332 Millard Ave
- 14316 Millard Ave
- 14336 Millard Ave
- 14312 Millard Ave
- 14340 Central Park Ave
- 14346 Central Park Ave
- 14340 Millard Ave
- 14356 Central Park Ave
- 14357 Millard Ave
- 14348 Millard Ave
- 14348 Millard Ave