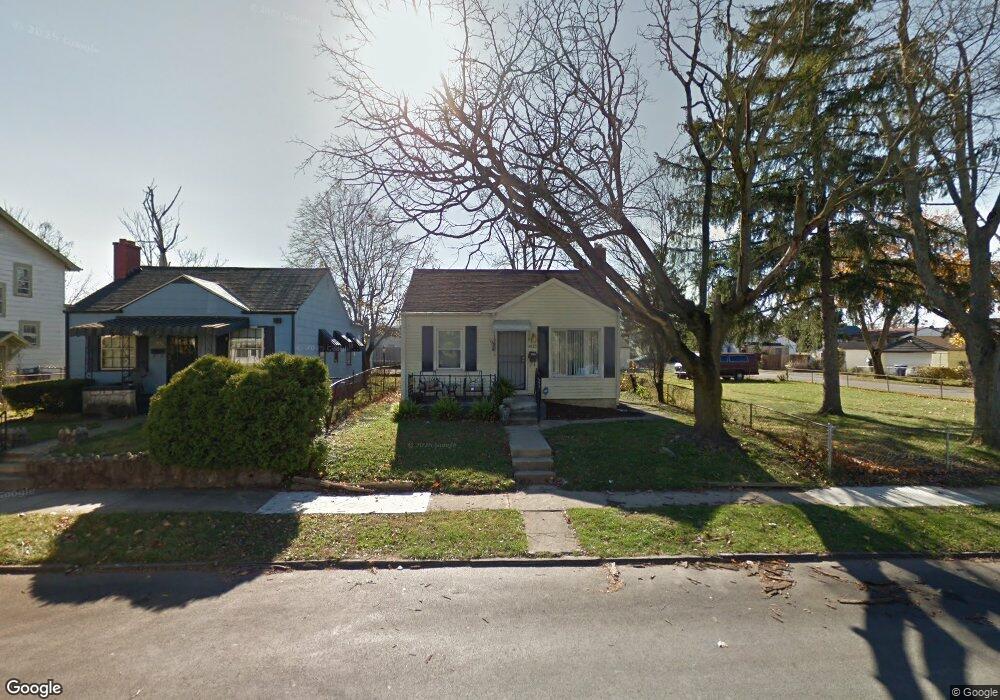
1433 E 21st Ave Columbus, OH 43211
South Linden NeighborhoodEstimated Value: $82,000 - $130,000
2
Beds
1
Bath
824
Sq Ft
$134/Sq Ft
Est. Value
About This Home
This home is located at 1433 E 21st Ave, Columbus, OH 43211 and is currently estimated at $110,275, approximately $133 per square foot. 1433 E 21st Ave is a home located in Franklin County with nearby schools including Windsor Stem Acadmey, Linden-Mckinley Stem School On Arcadia, and North Columbus Preparatory Academy.
Ownership History
Date
Name
Owned For
Owner Type
Purchase Details
Closed on
Sep 21, 2010
Sold by
Harper Dana L and Case #09Cve9 14182
Bought by
M & T Bank and Manufacturers & Traders Trust Company
Current Estimated Value
Purchase Details
Closed on
Aug 25, 2010
Sold by
M & T Bank
Bought by
Secretary Of Housing & Urban Development
Purchase Details
Closed on
Feb 14, 2001
Sold by
Hud
Bought by
Harper Dana L
Home Financials for this Owner
Home Financials are based on the most recent Mortgage that was taken out on this home.
Original Mortgage
$42,900
Interest Rate
6.91%
Mortgage Type
FHA
Purchase Details
Closed on
Jul 19, 2000
Sold by
Becton Steven A
Bought by
Hud
Purchase Details
Closed on
Apr 28, 1999
Sold by
Williams Talanna
Bought by
Becton Steven A
Purchase Details
Closed on
Jul 14, 1998
Sold by
Estate Of Joseph Williams
Bought by
Williams Talanna
Purchase Details
Closed on
May 18, 1979
Bought by
Williams Joseph and Williams Talanna
Create a Home Valuation Report for This Property
The Home Valuation Report is an in-depth analysis detailing your home's value as well as a comparison with similar homes in the area
Home Values in the Area
Average Home Value in this Area
Purchase History
We collect this data history from publicly available records. To have your information removed, we recommend requesting removal directly through your county’s website.
| Date | Buyer | Sale Price | Title Company |
|---|---|---|---|
| M & T Bank | $24,000 | Attorney | |
| Secretary Of Housing & Urban Development | -- | Independent | |
| Harper Dana L | $35,000 | Contract Processing & Title | |
| Hud | $28,600 | -- | |
| Becton Steven A | $39,000 | Ohio Land Title Agency | |
| Williams Talanna | -- | -- | |
| Williams Joseph | -- | -- |
Source: Public Records
Mortgage History
We collect this data history from publicly available records. To have your information removed, we recommend requesting removal directly through your county’s website.
| Date | Status | Borrower | Loan Amount |
|---|---|---|---|
| Previous Owner | Harper Dana L | $42,900 |
Source: Public Records
Tax History
| Year | Tax Paid | Tax Assessment Tax Assessment Total Assessment is a certain percentage of the fair market value that is determined by local assessors to be the total taxable value of land and additions on the property. | Land | Improvement |
|---|---|---|---|---|
| 2025 | $1,216 | $26,530 | $5,320 | $21,210 |
| 2024 | $1,216 | $26,530 | $5,320 | $21,210 |
| 2023 | $1,201 | $26,530 | $5,320 | $21,210 |
| 2022 | $705 | $13,270 | $2,350 | $10,920 |
| 2021 | $706 | $13,270 | $2,350 | $10,920 |
| 2020 | $1,246 | $13,270 | $2,350 | $10,920 |
| 2019 | $686 | $11,030 | $1,960 | $9,070 |
| 2018 | $342 | $11,030 | $1,960 | $9,070 |
| 2017 | $686 | $11,030 | $1,960 | $9,070 |
| 2016 | $640 | $9,420 | $2,520 | $6,900 |
| 2015 | $291 | $9,420 | $2,520 | $6,900 |
| 2014 | $584 | $9,420 | $2,520 | $6,900 |
| 2013 | $320 | $10,465 | $2,800 | $7,665 |
Source: Public Records
Map
Nearby Homes
- 1433 E 19th Ave
- 1363 E 19th Ave
- 1386 E 22nd Ave
- 1369-1371 E 18th Ave
- 1371 E 23rd Ave
- 1384 E 23rd Ave
- 1315 E 18th Ave
- 1303 E 22nd Ave
- 1514 E 24th Ave
- 1258 E 21st Ave
- 1266 E 22nd Ave
- 1251 E 23rd Ave
- 1341 E 15th Ave
- 1249-1251 E 15th Ave
- 1157-1159 E 18th Ave
- 1673 Cleveland Ave
- 1668 E 26th Ave
- 0 Windsor Ave
- 1366 Duxberry Ave
- 1129 E 17th Ave
- 1428 E 20th Ave
- 1438 E 20th Ave
- 1424 E 20th Ave
- 1442 E 20th Ave
- 1448 E 20th Ave
- 1452 E 20th Ave
- 1412 E 20th Ave
- 1431 E 20th Ave
- 1435 E 20th Ave
- 1425 E 20th Ave
- 1449 E 21st Ave
- 1439 E 20th Ave
- 1421 E 20th Ave
- 1456 E 20th Ave
- 1406 E 20th Ave
- 1445 E 20th Ave
- 1453 E 21st Ave
- 1457 E 21st Ave
- 1449 E 20th Ave
- 1462 E 20th Ave
Your Personal Tour Guide
Ask me questions while you tour the home.