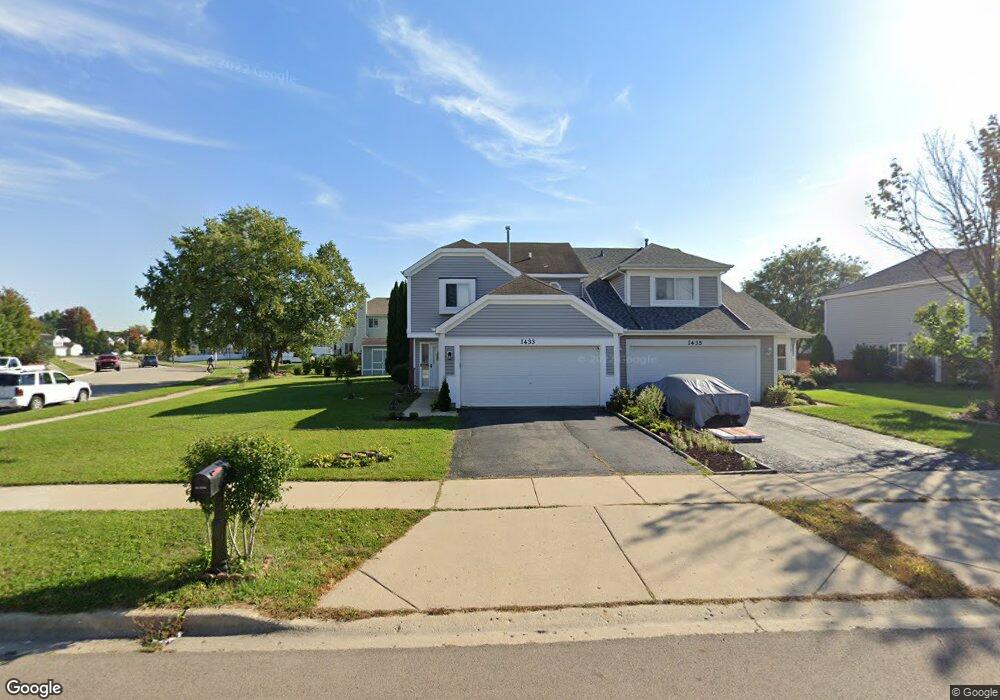
1433 N Pembroke Dr Unit 1433 South Elgin, IL 60177
Estimated Value: $296,000 - $314,666
3
Beds
3
Baths
1,491
Sq Ft
$203/Sq Ft
Est. Value
About This Home
This home is located at 1433 N Pembroke Dr Unit 1433, South Elgin, IL 60177 and is currently estimated at $303,417, approximately $203 per square foot. 1433 N Pembroke Dr Unit 1433 is a home located in Kane County with nearby schools including Fox Meadow Elementary School, Kenyon Woods Middle School, and South Elgin High School.
Ownership History
Date
Name
Owned For
Owner Type
Purchase Details
Closed on
Oct 21, 2015
Sold by
Fannie Mae
Bought by
Acevedo Edward
Current Estimated Value
Home Financials for this Owner
Home Financials are based on the most recent Mortgage that was taken out on this home.
Original Mortgage
$163,975
Outstanding Balance
$131,664
Interest Rate
4.5%
Mortgage Type
FHA
Estimated Equity
$171,753
Purchase Details
Closed on
Apr 13, 2015
Sold by
Avina Sergio P and Avina Tammy
Bought by
Federal National Mortgage Association
Purchase Details
Closed on
Nov 24, 2008
Sold by
Avina Sergio P
Bought by
Parsons Tammy L
Purchase Details
Closed on
Sep 2, 2005
Sold by
Wisser Cynthia
Bought by
Avina Sergio P and Avina Tammy
Home Financials for this Owner
Home Financials are based on the most recent Mortgage that was taken out on this home.
Original Mortgage
$161,600
Interest Rate
5.93%
Mortgage Type
Fannie Mae Freddie Mac
Create a Home Valuation Report for This Property
The Home Valuation Report is an in-depth analysis detailing your home's value as well as a comparison with similar homes in the area
Home Values in the Area
Average Home Value in this Area
Purchase History
| Date | Buyer | Sale Price | Title Company |
|---|---|---|---|
| Acevedo Edward | $167,000 | Central Illinois Title Co | |
| Federal National Mortgage Association | $138,700 | None Available | |
| Parsons Tammy L | -- | None Available | |
| Avina Sergio P | $202,000 | Chicago Title Insurance Comp |
Source: Public Records
Mortgage History
| Date | Status | Borrower | Loan Amount |
|---|---|---|---|
| Open | Acevedo Edward | $163,975 | |
| Previous Owner | Avina Sergio P | $161,600 |
Source: Public Records
Tax History Compared to Growth
Tax History
| Year | Tax Paid | Tax Assessment Tax Assessment Total Assessment is a certain percentage of the fair market value that is determined by local assessors to be the total taxable value of land and additions on the property. | Land | Improvement |
|---|---|---|---|---|
| 2024 | $5,543 | $78,237 | $17,524 | $60,713 |
| 2023 | $5,259 | $70,682 | $15,832 | $54,850 |
| 2022 | $5,030 | $64,450 | $14,436 | $50,014 |
| 2021 | $4,725 | $60,257 | $13,497 | $46,760 |
| 2020 | $4,548 | $57,525 | $12,885 | $44,640 |
| 2019 | $4,371 | $54,796 | $12,274 | $42,522 |
| 2018 | $4,274 | $51,621 | $11,563 | $40,058 |
| 2017 | $4,051 | $48,800 | $10,931 | $37,869 |
| 2016 | $3,842 | $45,033 | $10,141 | $34,892 |
| 2015 | -- | $41,277 | $9,295 | $31,982 |
| 2014 | -- | $40,767 | $9,180 | $31,587 |
| 2013 | -- | $41,842 | $9,422 | $32,420 |
Source: Public Records
Map
Nearby Homes
- 1419 S Pembroke Dr
- 25 Kingsport Ct
- 120 Kingsport Dr
- 8N594 S Mclean Blvd
- 1458 Woodland Dr
- 126 Kingsport Dr
- 435 Sandhurst Ln Unit 3
- 286 Kingsport Dr
- 282 Kingsport Dr
- 280 Kingsport Dr
- 281 Kingsport Dr
- 283 Kingsport Dr
- 285 Kingsport Dr
- 287 Kingsport Dr
- 289 Kingsport Dr
- 291 Kingsport Dr
- 306 Kingsport Dr
- 301 Kingsport Dr
- 304 Kingsport Dr
- 302 Kingsport Dr
- 1433 N Pembroke Dr
- 1435 N Pembroke Dr
- 1441 N Pembroke Dr
- 1430 Exeter Ln
- 1428 Exeter Ln
- 1436 Exeter Ln
- 1443 N Pembroke Dr
- 1443 N Pembroke Dr Unit 2
- 1438 Exeter Ln
- 45 Kingsport Dr
- 1428 N Pembroke Dr
- 1451 N Pembroke Dr
- 1430 N Pembroke Dr
- 1444 Exeter Ln
- 1438 N Pembroke Dr
- 43 Kingsport Dr
- 1440 N Pembroke Dr
- 1446 Exeter Ln
- 1453 N Pembroke Dr
- 11 Kingsport Dr