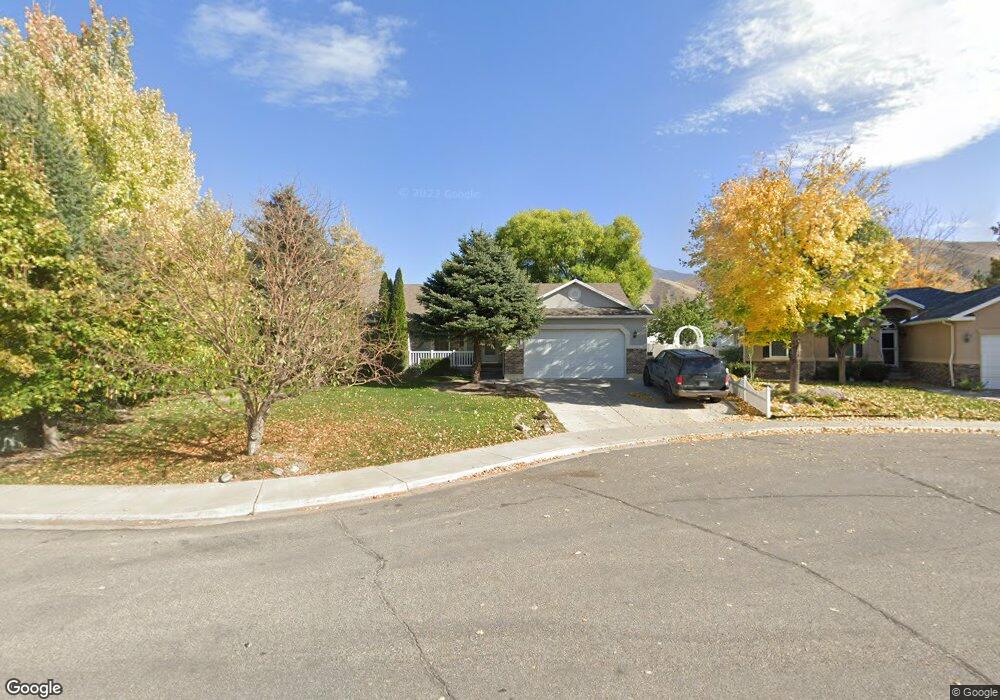
1433 S 680 W Payson, UT 84651
Estimated Value: $498,000 - $532,000
5
Beds
3
Baths
2,656
Sq Ft
$192/Sq Ft
Est. Value
About This Home
This home is located at 1433 S 680 W, Payson, UT 84651 and is currently estimated at $511,278, approximately $192 per square foot. 1433 S 680 W is a home located in Utah County with nearby schools including Spring Lake Elementary, Payson Junior High School, and Payson High School.
Ownership History
Date
Name
Owned For
Owner Type
Purchase Details
Closed on
Feb 17, 2015
Sold by
Mutz Jerry and Mutz Raelene
Bought by
Richins Kirk O and Richins Alberta K
Current Estimated Value
Home Financials for this Owner
Home Financials are based on the most recent Mortgage that was taken out on this home.
Original Mortgage
$216,930
Outstanding Balance
$165,537
Interest Rate
3.66%
Mortgage Type
VA
Estimated Equity
$345,741
Purchase Details
Closed on
Mar 5, 2008
Sold by
Hawkes Stanton
Bought by
Mutz Jerry and Mutz Raelene
Home Financials for this Owner
Home Financials are based on the most recent Mortgage that was taken out on this home.
Original Mortgage
$204,750
Interest Rate
5.72%
Mortgage Type
Purchase Money Mortgage
Purchase Details
Closed on
May 19, 2000
Sold by
Alpine Summit Homes Lc
Bought by
Hawkes Stanton
Home Financials for this Owner
Home Financials are based on the most recent Mortgage that was taken out on this home.
Original Mortgage
$143,500
Interest Rate
8.22%
Create a Home Valuation Report for This Property
The Home Valuation Report is an in-depth analysis detailing your home's value as well as a comparison with similar homes in the area
Home Values in the Area
Average Home Value in this Area
Purchase History
| Date | Buyer | Sale Price | Title Company |
|---|---|---|---|
| Richins Kirk O | -- | Backman Title Services Ltd | |
| Mutz Jerry | -- | Utah First Title Insurance | |
| Hawkes Stanton | -- | Wasatch Land & Title Insuran |
Source: Public Records
Mortgage History
| Date | Status | Borrower | Loan Amount |
|---|---|---|---|
| Open | Richins Kirk O | $216,930 | |
| Previous Owner | Mutz Jerry | $204,750 | |
| Previous Owner | Hawkes Stanton | $143,500 |
Source: Public Records
Tax History
| Year | Tax Paid | Tax Assessment Tax Assessment Total Assessment is a certain percentage of the fair market value that is determined by local assessors to be the total taxable value of land and additions on the property. | Land | Improvement |
|---|---|---|---|---|
| 2025 | $2,491 | $272,195 | -- | -- |
| 2024 | $2,491 | $253,495 | $0 | $0 |
| 2023 | $2,529 | $258,115 | $0 | $0 |
| 2022 | $2,447 | $245,575 | $0 | $0 |
| 2021 | $2,070 | $333,300 | $110,000 | $223,300 |
| 2020 | $1,963 | $309,100 | $100,000 | $209,100 |
| 2019 | $1,808 | $291,900 | $82,800 | $209,100 |
| 2018 | $1,684 | $262,000 | $72,400 | $189,600 |
| 2017 | $1,581 | $132,330 | $0 | $0 |
| 2016 | $1,513 | $125,785 | $0 | $0 |
| 2015 | $1,452 | $119,900 | $0 | $0 |
| 2014 | $1,311 | $109,065 | $0 | $0 |
Source: Public Records
Map
Nearby Homes
- 802 Brookside Ct
- 1468 S 910 W
- 609 W Saddlebrook Dr
- 613 W Saddlebrook Dr
- 1631 S Highway 198
- 1589 S 840 W
- 1320 S 950 W
- 1172 S 880 W
- 1333 S 1050 W
- 1463 S 260 W
- 1338 S 1050 W
- 1116 W 1290 S
- 2003 S 1150 W Unit 1040
- 1146 W 1260 S
- 991 S 930 W
- 1128 W 1150 S Unit 9
- 1216 S 1150 W Unit 19
- 245 W 1770 S
- 1835 S 410 W
- 1733 S 1100 W
- 1427 S 680 W
- 1427 S 680 W Unit 32
- 1439 S 680 W
- 1423 S 680 W
- 1423 S 680 W Unit lot 31
- 1445 S 680 W
- 1445 S 680 W Unit 35
- 1435 Utah 198
- 1428 S 680 W
- 1435 S Highway 198
- 1434 S 680 W
- 1425 S Highway 198
- 1442 S 680 W
- 1422 S 680 W
- 1438 S 680 W
- 615 W 1450 S
- 697 W 1410 S
- 1412 S 600 W
- 704 W 1460 S
- 672 W 1410 S
Your Personal Tour Guide
Ask me questions while you tour the home.