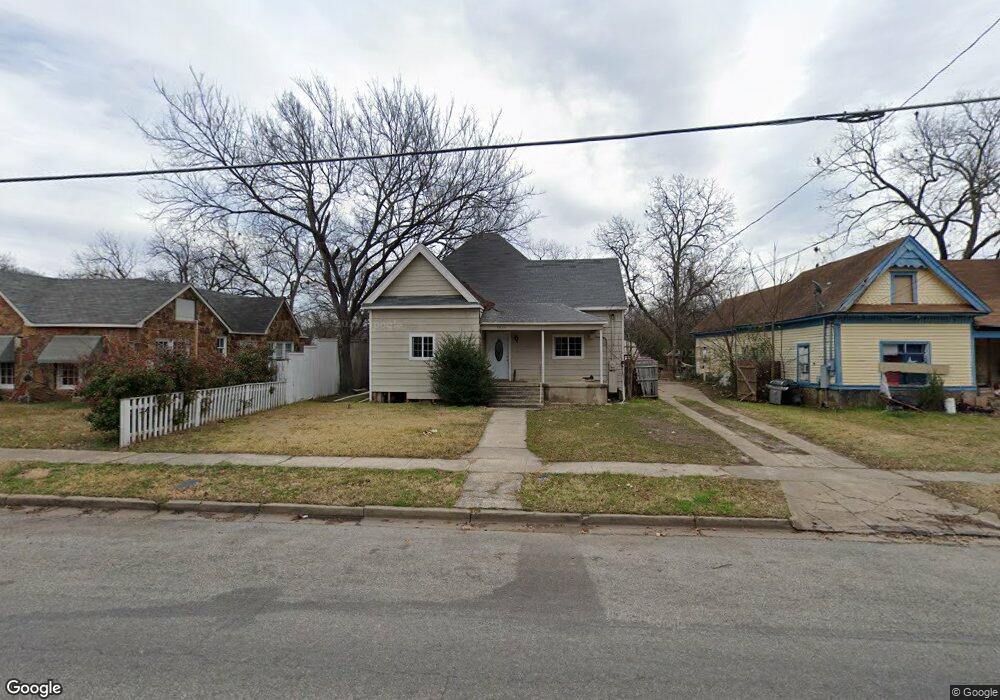
1433 S Travis St Unit A Sherman, TX 75090
Estimated Value: $247,236 - $255,000
2
Beds
2
Baths
1,000
Sq Ft
$251/Sq Ft
Est. Value
About This Home
This home is located at 1433 S Travis St Unit A, Sherman, TX 75090 and is currently estimated at $251,118, approximately $251 per square foot. 1433 S Travis St Unit A is a home located in Grayson County with nearby schools including Washington Elementary School, Piner Middle School, and Dillingham Intermediate School.
Ownership History
Date
Name
Owned For
Owner Type
Purchase Details
Closed on
Oct 29, 2021
Sold by
Barakat Michael and Barakat Charbel
Bought by
Big Biz Llc Series A
Current Estimated Value
Home Financials for this Owner
Home Financials are based on the most recent Mortgage that was taken out on this home.
Original Mortgage
$156,000
Outstanding Balance
$133,157
Interest Rate
3.14%
Mortgage Type
Future Advance Clause Open End Mortgage
Estimated Equity
$117,961
Purchase Details
Closed on
Feb 26, 2021
Sold by
Valle Israel De Jacob
Bought by
Westoplex Renewal Co Llc
Purchase Details
Closed on
Apr 13, 2017
Sold by
Smith Halely
Bought by
Ville Israel De Jacob
Purchase Details
Closed on
Sep 11, 2012
Sold by
Shearer Timothy Randle
Bought by
Shearer Christopher Michael
Purchase Details
Closed on
Oct 2, 2006
Sold by
Southwest Bgn Partners Ltd
Bought by
Kerr Haley
Home Financials for this Owner
Home Financials are based on the most recent Mortgage that was taken out on this home.
Original Mortgage
$54,468
Interest Rate
6.47%
Mortgage Type
Purchase Money Mortgage
Create a Home Valuation Report for This Property
The Home Valuation Report is an in-depth analysis detailing your home's value as well as a comparison with similar homes in the area
Home Values in the Area
Average Home Value in this Area
Purchase History
| Date | Buyer | Sale Price | Title Company |
|---|---|---|---|
| Big Biz Llc Series A | -- | Fidelity National | |
| Westoplex Renewal Co Llc | -- | None Available | |
| Ville Israel De Jacob | -- | None Available | |
| Shearer Christopher Michael | -- | None Available | |
| Kerr Haley | -- | Red River Title Co |
Source: Public Records
Mortgage History
| Date | Status | Borrower | Loan Amount |
|---|---|---|---|
| Open | Big Biz Llc Series A | $156,000 | |
| Previous Owner | Kerr Haley | $54,468 |
Source: Public Records
Tax History Compared to Growth
Tax History
| Year | Tax Paid | Tax Assessment Tax Assessment Total Assessment is a certain percentage of the fair market value that is determined by local assessors to be the total taxable value of land and additions on the property. | Land | Improvement |
|---|---|---|---|---|
| 2025 | $5,422 | $244,584 | $66,918 | $177,666 |
| 2024 | $5,422 | $247,200 | $66,456 | $180,744 |
| 2023 | $4,583 | $208,752 | $54,789 | $153,963 |
| 2022 | $5,667 | $241,823 | $49,750 | $192,073 |
| 2021 | $4,466 | $178,172 | $29,351 | $148,821 |
| 2020 | $1,738 | $66,216 | $18,183 | $48,033 |
| 2019 | $1,554 | $57,658 | $4,154 | $53,504 |
| 2018 | $1,384 | $55,161 | $4,154 | $51,007 |
| 2017 | $1,047 | $53,369 | $4,154 | $49,215 |
| 2016 | $951 | $41,219 | $4,154 | $37,065 |
| 2015 | $469 | $34,748 | $4,154 | $30,594 |
| 2014 | $875 | $45,715 | $4,154 | $41,561 |
Source: Public Records
Map
Nearby Homes
- 1519 S Travis St
- 1326 S Walnut St
- 119 W Lake St
- 1323 S Montgomery St
- 1219 S Montgomery St
- 230 W Lake St
- 1220 S Branch St
- 419 S Montgomery St
- 411 W Hester St
- 1228 S Rusk St
- 1114 S Crockett St
- 1426 S Austin St
- 000 S Branch St
- TBD Branch St
- TBD S Branch St
- TBD S 1st St
- 2901 S 1st St
- 303 W Steadman St
- 929 S Montgomery St
- 718 E Martin Ln
- 1433 S Travis St
- 1433 S Travis St Unit B
- 1437 S Travis St
- 1419 S Travis St
- 1415 S Travis St
- 1443 S Travis St
- 1424 S Travis St
- 1424 S Walnut St
- 1428 S Walnut St
- 115 E Olive St
- 1407 S Travis St
- 1407 S Travis St Unit B
- 1420 S Walnut St
- 1434 S Travis St
- 119 E Olive St
- 1406 S Walnut St
- 1416 S Travis St
- 1416 S Travis St Unit 3
- 1416 S Travis St Unit 2
- 1416 S Travis St Unit 1