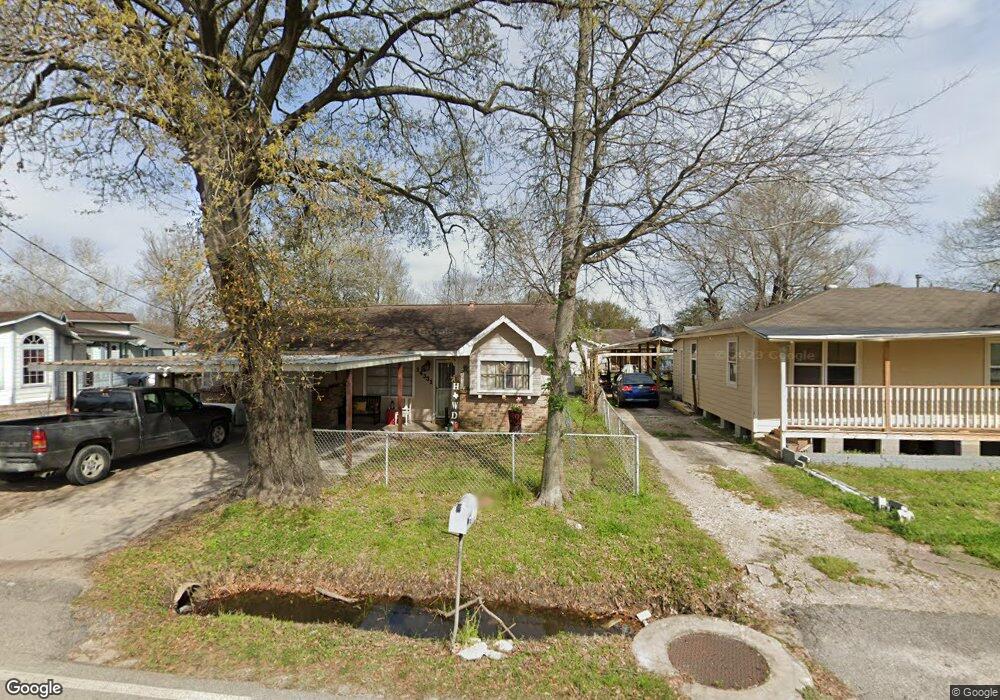
14331 Renault St Houston, TX 77015
Estimated Value: $131,005 - $161,000
2
Beds
1
Bath
1,054
Sq Ft
$139/Sq Ft
Est. Value
About This Home
This home is located at 14331 Renault St, Houston, TX 77015 and is currently estimated at $146,751, approximately $139 per square foot. 14331 Renault St is a home located in Harris County with nearby schools including Cloverleaf Elementary School, Cobb 6th Grade Campus, and North Shore Middle School.
Ownership History
Date
Name
Owned For
Owner Type
Purchase Details
Closed on
Oct 18, 2018
Sold by
Cruz Arthurnick
Bought by
Cruz Arthur N and Lara Genesis
Current Estimated Value
Home Financials for this Owner
Home Financials are based on the most recent Mortgage that was taken out on this home.
Original Mortgage
$65,000
Outstanding Balance
$56,684
Interest Rate
4.5%
Mortgage Type
Seller Take Back
Estimated Equity
$90,067
Purchase Details
Closed on
Oct 12, 2017
Sold by
Home Holdings Lp
Bought by
Estrada Luis Angel and Estrada Alma Rosa
Home Financials for this Owner
Home Financials are based on the most recent Mortgage that was taken out on this home.
Original Mortgage
$112,100
Interest Rate
3.94%
Mortgage Type
Purchase Money Mortgage
Purchase Details
Closed on
Jun 3, 2014
Sold by
Wood Michael Allen and Wood Carl E
Bought by
Avignon Holdings Llc
Create a Home Valuation Report for This Property
The Home Valuation Report is an in-depth analysis detailing your home's value as well as a comparison with similar homes in the area
Home Values in the Area
Average Home Value in this Area
Purchase History
| Date | Buyer | Sale Price | Title Company |
|---|---|---|---|
| Cruz Arthur N | -- | None Available | |
| Estrada Luis Angel | -- | None Available | |
| Avignon Holdings Llc | $30,000 | None Available |
Source: Public Records
Mortgage History
| Date | Status | Borrower | Loan Amount |
|---|---|---|---|
| Open | Cruz Arthur N | $65,000 | |
| Previous Owner | Estrada Luis Angel | $112,100 |
Source: Public Records
Tax History
| Year | Tax Paid | Tax Assessment Tax Assessment Total Assessment is a certain percentage of the fair market value that is determined by local assessors to be the total taxable value of land and additions on the property. | Land | Improvement |
|---|---|---|---|---|
| 2025 | $659 | $117,251 | $53,750 | $63,501 |
| 2024 | $659 | $121,494 | $53,750 | $67,744 |
| 2023 | $659 | $126,465 | $32,250 | $94,215 |
| 2022 | $1,448 | $104,702 | $32,250 | $72,452 |
| 2021 | $1,423 | $80,710 | $25,532 | $55,178 |
| 2020 | $1,457 | $69,466 | $25,532 | $43,934 |
| 2019 | $1,452 | $55,559 | $25,532 | $30,027 |
| 2018 | $201 | $47,205 | $25,532 | $21,673 |
| 2017 | $1,029 | $36,900 | $25,532 | $11,368 |
| 2016 | $1,029 | $36,900 | $25,532 | $11,368 |
| 2015 | $996 | $43,986 | $25,532 | $18,454 |
| 2014 | $996 | $36,615 | $18,813 | $17,802 |
Source: Public Records
Map
Nearby Homes
- 14434 Hillsboro St
- 14435 Hillsboro St
- 14307 Laredo St
- 813 Barbara Mae St
- 14134 Brownsville St
- 14613 Hillsboro St
- 14110 Brownsville St
- 1137 Freeport St
- 14500 Corpus Christi St Unit 4
- 14504 Corpus Christi St Unit 4
- 14622 Kenny St
- 14506 Corpus Christi St Unit 4
- 13938 Brownwood St
- 14615 Victoria St
- 0 Victoria St
- 14334 Texarkana St
- 14512 Texarkana St
- 13839 Laredo St
- 13927 Victoria St Unit 5
- 0 Longview St
- 14333 Renault St
- 14305 Renault St
- 14338 Duncum St
- 14326 Duncum St
- 14324 Renault St
- 14330 Renault St
- 14334 Renault St
- 14318 Duncum St
- 14338 Renault St
- 1110 Cloverleaf
- 14315 Garber Ln
- 14323 Garber Ln
- 14331 Duncum St
- 14327 Duncum St
- 14319 Garber Ln
- 14319 Garber Ln
- 1115 Barbara Mae St
- 14308 Duncum St
- 1122 Cloverleaf St
- 14323 Duncum St
Your Personal Tour Guide
Ask me questions while you tour the home.