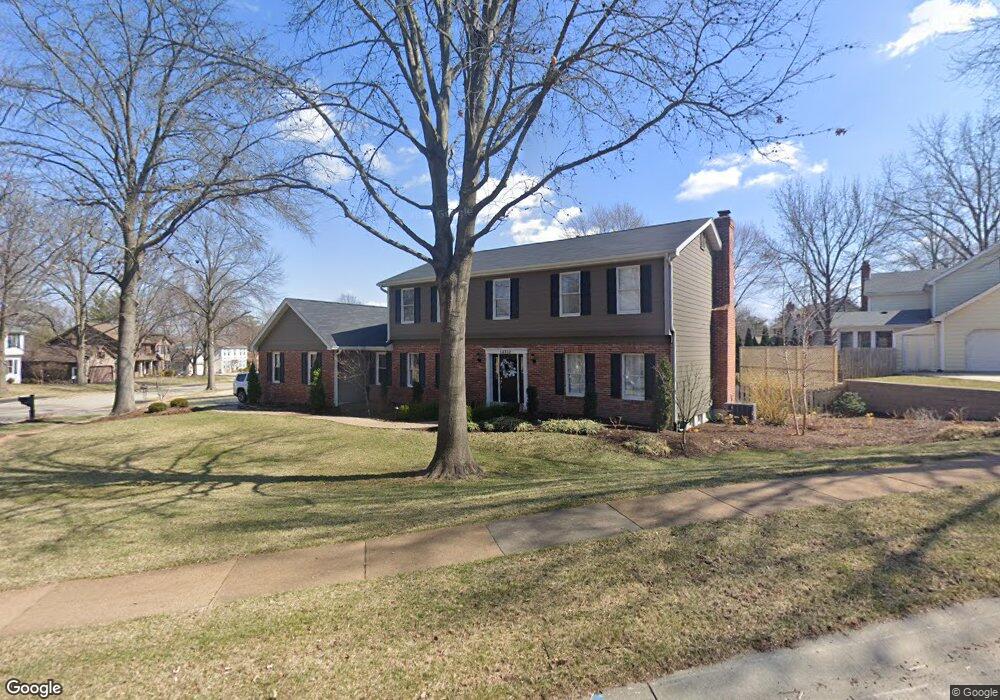
14332 Strawbridge Ct Chesterfield, MO 63017
Estimated Value: $576,000 - $624,000
4
Beds
3
Baths
2,772
Sq Ft
$219/Sq Ft
Est. Value
About This Home
This home is located at 14332 Strawbridge Ct, Chesterfield, MO 63017 and is currently estimated at $606,368, approximately $218 per square foot. 14332 Strawbridge Ct is a home located in St. Louis County with nearby schools including Green Trails Elementary School, Parkway Central Middle School, and Parkway Central High School.
Ownership History
Date
Name
Owned For
Owner Type
Purchase Details
Closed on
Dec 21, 2020
Sold by
Hagenbrock David W and David W Hagenbrock Trust
Bought by
Hagenbrock David W and Fridley Shelley Lyn
Current Estimated Value
Purchase Details
Closed on
Jan 9, 2003
Sold by
Hagenbrock David W
Bought by
The Indenture Trust Agreement Of David W and Hagenbrock David W
Purchase Details
Closed on
Nov 13, 2002
Sold by
Hagenbrock David W
Bought by
Hagenbrock David W
Purchase Details
Closed on
Nov 10, 1998
Sold by
Hagenbrock David W and Hagenbrock Sandra M
Bought by
Hagenbrock David W
Home Financials for this Owner
Home Financials are based on the most recent Mortgage that was taken out on this home.
Original Mortgage
$220,800
Interest Rate
6.46%
Create a Home Valuation Report for This Property
The Home Valuation Report is an in-depth analysis detailing your home's value as well as a comparison with similar homes in the area
Home Values in the Area
Average Home Value in this Area
Purchase History
| Date | Buyer | Sale Price | Title Company |
|---|---|---|---|
| Hagenbrock David W | -- | None Available | |
| The Indenture Trust Agreement Of David W | -- | -- | |
| Hagenbrock David W | -- | -- | |
| Hagenbrock David W | -- | -- |
Source: Public Records
Mortgage History
| Date | Status | Borrower | Loan Amount |
|---|---|---|---|
| Closed | Hagenbrock David W | $220,800 |
Source: Public Records
Tax History Compared to Growth
Tax History
| Year | Tax Paid | Tax Assessment Tax Assessment Total Assessment is a certain percentage of the fair market value that is determined by local assessors to be the total taxable value of land and additions on the property. | Land | Improvement |
|---|---|---|---|---|
| 2025 | $5,661 | $100,090 | $43,640 | $56,450 |
| 2024 | $5,661 | $85,610 | $27,170 | $58,440 |
| 2023 | $5,430 | $85,610 | $27,170 | $58,440 |
| 2022 | $5,408 | $77,600 | $31,030 | $46,570 |
| 2021 | $5,386 | $77,600 | $31,030 | $46,570 |
| 2020 | $5,319 | $73,610 | $30,630 | $42,980 |
| 2019 | $5,204 | $73,610 | $30,630 | $42,980 |
| 2018 | $5,330 | $69,940 | $23,030 | $46,910 |
| 2017 | $5,185 | $69,940 | $23,030 | $46,910 |
| 2016 | $4,803 | $61,540 | $16,680 | $44,860 |
| 2015 | $5,035 | $61,540 | $16,680 | $44,860 |
| 2014 | $4,911 | $64,200 | $12,960 | $51,240 |
Source: Public Records
Map
Nearby Homes
- 14121 Westernmill Dr
- 85 Glen Cove Dr
- 14257 Forest Crest Dr
- 14325 Gatwick Ct
- 14327 Bramblewood Ct
- 76 Glen Cove Dr
- 609 Spyglass Summit Dr
- 548 Eagle Manor Ln
- 14312 Spyglass Ridge
- 14316 Spyglass Ridge
- 596 Eagle Manor Ln
- 216 San Angelo Dr
- 621 Old Riverwoods Ln
- 56 Forest Crest Dr
- 697 Waterworks Rd
- 153 Kendall Bluff Ct
- 13579 Coliseum Dr Unit G
- 13573 Coliseum Dr
- 14036 Agusta Dr
- 214 Cordovan Commons Pkwy
- 424 Strawbridge Dr
- 14326 Strawbridge Ct
- 14333 Strawbridge Ct
- 425 Strawbridge Dr
- 14319 Cobble Ct
- 431 Strawbridge Dr
- 14327 Strawbridge Ct
- 14320 Strawbridge Ct
- 419 Strawbridge Dr
- 437 Strawbridge Dr
- 14321 Strawbridge Ct
- 14258 Cypress Hill Dr
- 14313 Cobble Ct
- 14252 Cypress Hill Dr
- 412 Strawbridge Dr
- 442 Greenstone Dr
- 14314 Strawbridge Ct
- 413 Strawbridge Dr
- 448 Greenstone Dr
- 14318 Cobble Ct