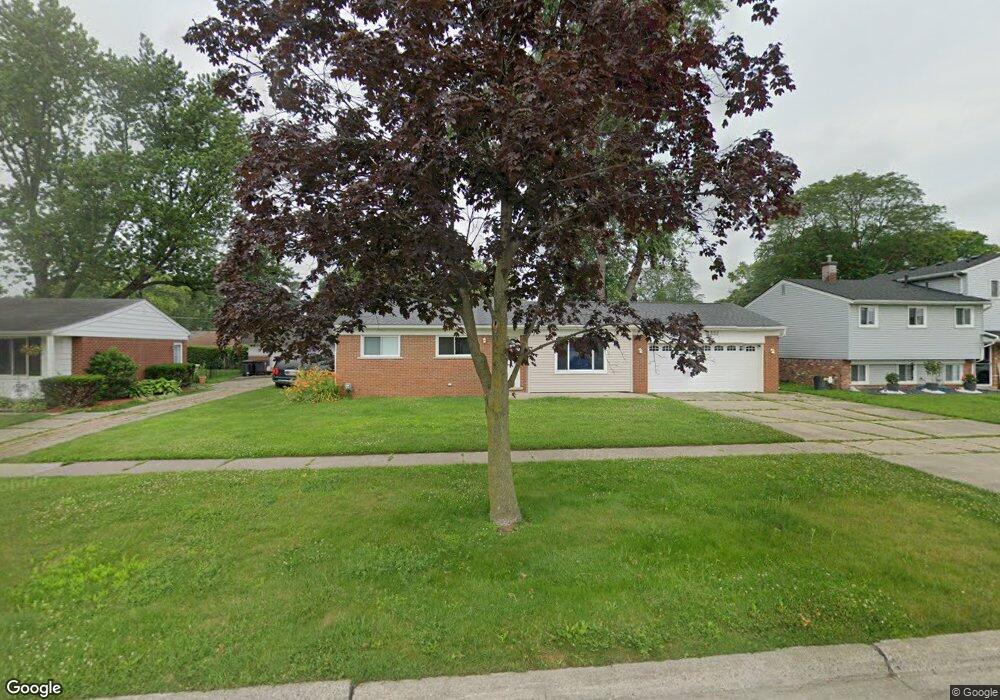
14333 Harrison St Unit Bldg-Unit Livonia, MI 48154
Estimated Value: $327,000 - $355,000
--
Bed
2
Baths
1,594
Sq Ft
$214/Sq Ft
Est. Value
About This Home
This home is located at 14333 Harrison St Unit Bldg-Unit, Livonia, MI 48154 and is currently estimated at $340,666, approximately $213 per square foot. 14333 Harrison St Unit Bldg-Unit is a home located in Wayne County with nearby schools including Roosevelt Elementary School, Emerson Middle School, and Cooper Upper Elementary School.
Ownership History
Date
Name
Owned For
Owner Type
Purchase Details
Closed on
Dec 22, 2023
Sold by
Gavin Amy
Bought by
Carr Benjamin
Current Estimated Value
Purchase Details
Closed on
Feb 27, 2018
Sold by
Newcomb John and Newcomb Jessica
Bought by
Duprey Amy
Purchase Details
Closed on
Feb 20, 2007
Sold by
Podojil Carol A
Bought by
Newcomb John
Home Financials for this Owner
Home Financials are based on the most recent Mortgage that was taken out on this home.
Original Mortgage
$24,900
Interest Rate
6.28%
Mortgage Type
Stand Alone Second
Purchase Details
Closed on
Nov 12, 2001
Sold by
Podojil Frank and Podojil Lucy E
Bought by
Podojil Frank and Frank Podojil Trust Agreement
Purchase Details
Closed on
Jul 1, 1997
Sold by
Car Christopher D and Car Dawn
Bought by
Johnson George E
Purchase Details
Closed on
Dec 12, 1996
Sold by
Kra Joseph N and Kra Loretta
Bought by
Hunt Susan L and Johnson George
Create a Home Valuation Report for This Property
The Home Valuation Report is an in-depth analysis detailing your home's value as well as a comparison with similar homes in the area
Home Values in the Area
Average Home Value in this Area
Purchase History
| Date | Buyer | Sale Price | Title Company |
|---|---|---|---|
| Carr Benjamin | $318,900 | None Listed On Document | |
| Duprey Amy | $187,000 | Vintage Title Agency | |
| Newcomb John | $166,000 | Independence Title | |
| Podojil Frank | -- | -- | |
| Johnson George E | $99,900 | -- | |
| Hunt Susan L | $90,000 | -- |
Source: Public Records
Mortgage History
| Date | Status | Borrower | Loan Amount |
|---|---|---|---|
| Previous Owner | Newcomb John | $24,900 | |
| Previous Owner | Newcomb John | $132,800 |
Source: Public Records
Tax History Compared to Growth
Tax History
| Year | Tax Paid | Tax Assessment Tax Assessment Total Assessment is a certain percentage of the fair market value that is determined by local assessors to be the total taxable value of land and additions on the property. | Land | Improvement |
|---|---|---|---|---|
| 2025 | $2,993 | $141,400 | $0 | $0 |
| 2024 | $2,993 | $135,400 | $0 | $0 |
| 2023 | $2,227 | $120,700 | $0 | $0 |
| 2022 | $3,983 | $107,900 | $0 | $0 |
| 2021 | $3,823 | $102,300 | $0 | $0 |
| 2019 | $3,683 | $88,600 | $0 | $0 |
| 2018 | $1,483 | $84,000 | $0 | $0 |
| 2017 | $4,101 | $80,300 | $0 | $0 |
| 2016 | $2,841 | $80,300 | $0 | $0 |
| 2015 | $6,645 | $73,270 | $0 | $0 |
| 2012 | -- | $62,880 | $15,460 | $47,420 |
Source: Public Records
Map
Nearby Homes
- 14334 Sunbury St
- 14483 Garden St
- 29109 Perth St
- 14488 Summerside St
- 27674 Western Golf Dr
- 14907 Taylor Blvd
- 27407 Buckingham St
- 29631 Lyndon St
- 14920 Taylor Blvd
- 13968 Inkster Rd
- LOT 149 Seminole
- LOT 147 Seminole
- 14844 Inkster Rd
- 14068 Mercedes
- 14008 Mercedes
- 14962 Beatrice St
- 27510 Five Mile Rd
- 29831 Oakley St
- 14174 San Jose
- 27480 5 Mile Rd
- 14333 Harrison St
- 14349 Harrison St
- 14317 Harrison St
- 14365 Harrison St
- 14301 Harrison St
- 14362 Brentwood St
- 14378 Brentwood St
- 14350 Brentwood St
- 14390 Brentwood St
- 14381 Harrison St
- 14229 Harrison St
- 14336 Brentwood St
- 14406 Brentwood St
- 14322 Brentwood St
- 14411 Harrison St
- 14217 Harrison St
- 14418 Brentwood St
- 14308 Brentwood St
- 14357 Brentwood St
- 14369 Brentwood St