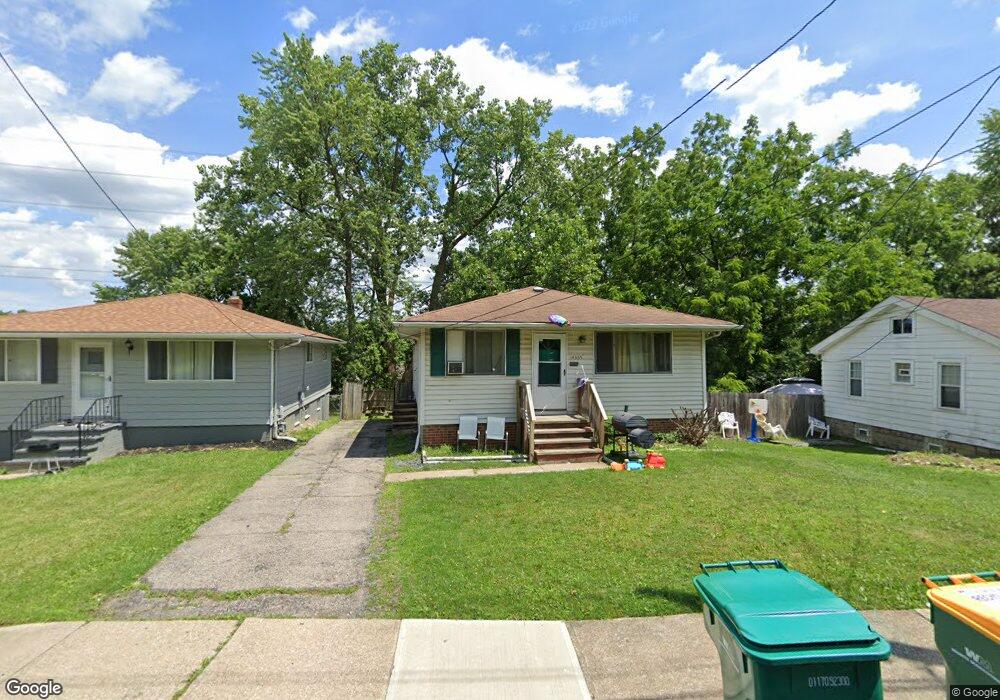
14335 Maple Ave Maple Heights, OH 44137
Estimated Value: $101,000 - $150,000
3
Beds
1
Bath
988
Sq Ft
$127/Sq Ft
Est. Value
About This Home
This home is located at 14335 Maple Ave, Maple Heights, OH 44137 and is currently estimated at $125,745, approximately $127 per square foot. 14335 Maple Ave is a home located in Cuyahoga County with nearby schools including Abraham Lincoln Elementary School, Rockside/ J.F. Kennedy School, and Barack Obama School.
Ownership History
Date
Name
Owned For
Owner Type
Purchase Details
Closed on
Nov 26, 2001
Sold by
Johnson Theresa L
Bought by
Johnson James and Johnson Theresa L
Current Estimated Value
Home Financials for this Owner
Home Financials are based on the most recent Mortgage that was taken out on this home.
Original Mortgage
$75,150
Outstanding Balance
$30,833
Interest Rate
8.2%
Estimated Equity
$94,912
Purchase Details
Closed on
Apr 21, 1992
Sold by
Sangrik Thomas
Bought by
Johnson Theresa L
Purchase Details
Closed on
Oct 30, 1991
Bought by
Sangrik Thomas
Purchase Details
Closed on
Jan 7, 1991
Sold by
Sams Jimmie D
Bought by
Sec Of H U D
Purchase Details
Closed on
Dec 5, 1988
Sold by
Todaro Marilyn
Bought by
Sams Jimmie D
Purchase Details
Closed on
Jan 1, 1975
Bought by
Todaro Marilyn
Create a Home Valuation Report for This Property
The Home Valuation Report is an in-depth analysis detailing your home's value as well as a comparison with similar homes in the area
Home Values in the Area
Average Home Value in this Area
Purchase History
| Date | Buyer | Sale Price | Title Company |
|---|---|---|---|
| Johnson James | -- | Quality Title Agency Inc | |
| Johnson Theresa L | $54,500 | -- | |
| Sangrik Thomas | -- | -- | |
| Sec Of H U D | -- | -- | |
| Sams Jimmie D | $48,000 | -- | |
| Todaro Marilyn | -- | -- |
Source: Public Records
Mortgage History
| Date | Status | Borrower | Loan Amount |
|---|---|---|---|
| Open | Johnson James | $75,150 |
Source: Public Records
Tax History
| Year | Tax Paid | Tax Assessment Tax Assessment Total Assessment is a certain percentage of the fair market value that is determined by local assessors to be the total taxable value of land and additions on the property. | Land | Improvement |
|---|---|---|---|---|
| 2025 | $3,093 | $38,430 | $6,195 | $32,235 |
| 2024 | $3,439 | $38,430 | $6,195 | $32,235 |
| 2023 | $3,835 | $23,110 | $3,610 | $19,500 |
| 2022 | $2,448 | $23,100 | $3,610 | $19,500 |
| 2021 | $2,610 | $23,100 | $3,610 | $19,500 |
| 2020 | $2,227 | $17,500 | $2,730 | $14,770 |
| 2019 | $2,215 | $50,000 | $7,800 | $42,200 |
| 2018 | $2,166 | $17,500 | $2,730 | $14,770 |
| 2017 | $2,296 | $17,960 | $3,500 | $14,460 |
| 2016 | $2,221 | $17,960 | $3,500 | $14,460 |
| 2015 | $2,109 | $17,960 | $3,500 | $14,460 |
| 2014 | $2,109 | $18,520 | $3,610 | $14,910 |
Source: Public Records
Map
Nearby Homes
- 14510 Granger Rd
- 14512 Granger Rd
- 15264 Broadway Ave
- 13801 Bangor Ave
- 13600 Royal Blvd
- 5408 Roland Dr
- 5270 E 135th St
- 5137 Miller Ave
- 4955 E 141st St
- 16029 Friend Ave
- 5380 E 131st St
- 16101 Raymond St
- 16174 Friend Ave
- 13009 Willard Ave
- 5370 Lee Rd Unit 302
- 13019 Darlington Ave
- 13116 Oak Park Blvd
- 12913 Darlington Ave
- 16241 Glenburn Ave
- 13206 Shady Oak Blvd
Your Personal Tour Guide
Ask me questions while you tour the home.