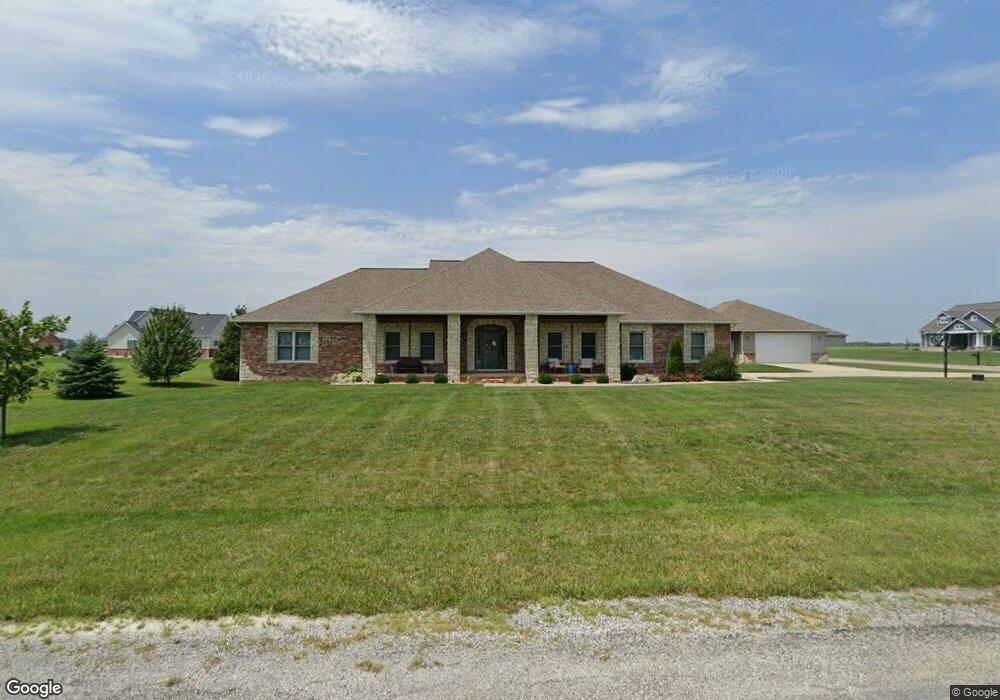
14337 N Fork Aviston, IL 62216
Estimated Value: $541,000 - $592,000
4
Beds
3
Baths
2,632
Sq Ft
$216/Sq Ft
Est. Value
About This Home
This home is located at 14337 N Fork, Aviston, IL 62216 and is currently estimated at $569,214, approximately $216 per square foot. 14337 N Fork is a home located in Clinton County with nearby schools including Aviston Elementary School and Central Community High School.
Ownership History
Date
Name
Owned For
Owner Type
Purchase Details
Closed on
Jul 7, 2025
Sold by
Pritchard Cory James and Pritchard Family Trust Pritchard Family Trust
Bought by
Falconio Anthony J and Falconio Heather L
Current Estimated Value
Home Financials for this Owner
Home Financials are based on the most recent Mortgage that was taken out on this home.
Original Mortgage
$551,000
Outstanding Balance
$550,074
Interest Rate
6.89%
Mortgage Type
Construction
Estimated Equity
$19,140
Purchase Details
Closed on
Apr 1, 2020
Sold by
Pritchard Cory James and Pritchard Amberlee Nicole
Bought by
Pritchard Cory James and Pritchard Amberlee Nicole
Purchase Details
Closed on
Dec 13, 2019
Sold by
Hattan Angela M
Bought by
Pritchard Cory J and Pritchard Amberlee N
Home Financials for this Owner
Home Financials are based on the most recent Mortgage that was taken out on this home.
Original Mortgage
$266,000
Interest Rate
3.7%
Mortgage Type
New Conventional
Purchase Details
Closed on
Jan 8, 2018
Sold by
Hattan Shaun R and Hattan Angela M
Bought by
Hattan Angela M
Purchase Details
Closed on
Sep 26, 2008
Sold by
Clinton Acres Inc
Bought by
Hattan Shaun R and Hattan Angela M
Create a Home Valuation Report for This Property
The Home Valuation Report is an in-depth analysis detailing your home's value as well as a comparison with similar homes in the area
Purchase History
| Date | Buyer | Sale Price | Title Company |
|---|---|---|---|
| Falconio Anthony J | $580,000 | Highland Community Title | |
| Pritchard Cory James | -- | None Available | |
| Pritchard Cory J | $332,500 | None Available | |
| Hattan Angela M | -- | Benchmark Title Co | |
| Hattan Shaun R | $35,000 | None Available |
Source: Public Records
Mortgage History
| Date | Status | Borrower | Loan Amount |
|---|---|---|---|
| Open | Falconio Anthony J | $551,000 | |
| Previous Owner | Pritchard Cory J | $266,000 |
Source: Public Records
Tax History
| Year | Tax Paid | Tax Assessment Tax Assessment Total Assessment is a certain percentage of the fair market value that is determined by local assessors to be the total taxable value of land and additions on the property. | Land | Improvement |
|---|---|---|---|---|
| 2024 | $10,572 | $171,010 | $15,700 | $155,310 |
| 2023 | $10,189 | $161,330 | $14,810 | $146,520 |
| 2022 | $10,189 | $152,490 | $14,270 | $138,220 |
| 2021 | $7,618 | $123,930 | $13,590 | $110,340 |
| 2020 | $7,590 | $119,170 | $13,070 | $106,100 |
| 2019 | $7,560 | $119,170 | $13,070 | $106,100 |
| 2018 | $7,195 | $108,896 | $9,608 | $99,288 |
| 2017 | $7,023 | $103,710 | $9,150 | $94,560 |
| 2016 | $7,057 | $103,710 | $9,150 | $94,560 |
| 2015 | $6,442 | $103,710 | $9,150 | $94,560 |
| 2013 | $6,442 | $105,830 | $9,150 | $96,680 |
Source: Public Records
Map
Nearby Homes
- 4650 Wyatt Way
- 365 Briarwood Ln
- 103 S Hull St
- 887 W 3rd St
- 3265 Venhaus Rd
- 12702 Crestview Ln
- 12746 Rolling Hills Dr
- 630 Wedgewood Ln
- 619 Wedgewood Ln
- 607 Wedgewood Ln
- 525 Wedgewood Ln
- 501 Wedgewood Ln
- 1144 Emily Ln
- 679 Galen Dr
- 437 Galen Dr
- 13636 Alpine Way
- 13613 Alpine Way
- 436 N Olive St
- 1251 Sunset Dr
- 416 N Main St
Your Personal Tour Guide
Ask me questions while you tour the home.