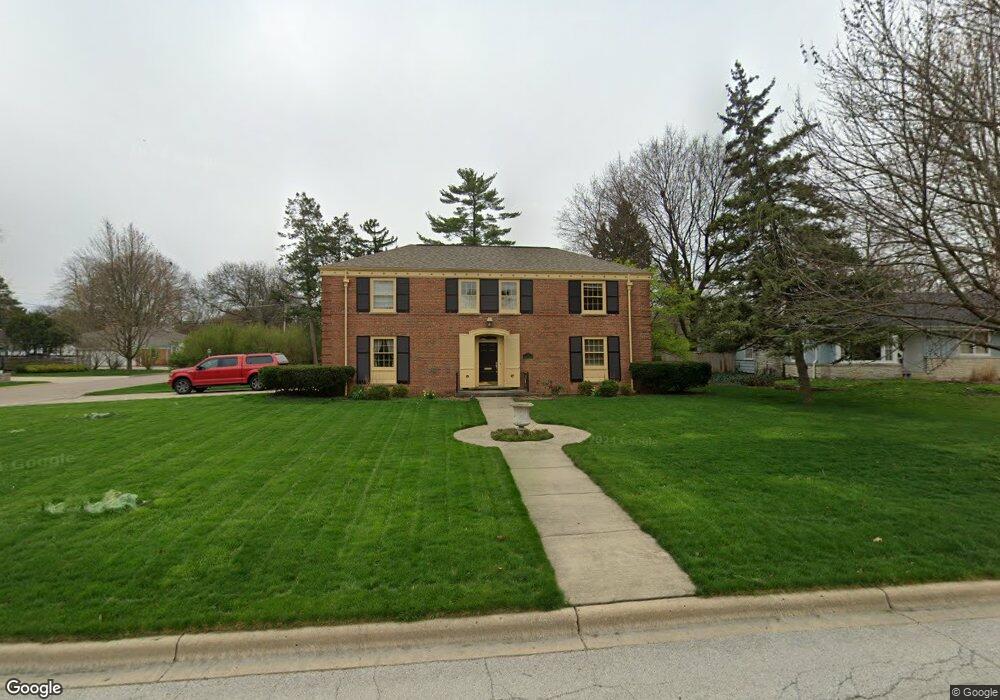
1434 W Downer Place Aurora, IL 60506
Blackhawk NeighborhoodEstimated Value: $469,000 - $522,877
4
Beds
3
Baths
2,684
Sq Ft
$183/Sq Ft
Est. Value
About This Home
This home is located at 1434 W Downer Place, Aurora, IL 60506 and is currently estimated at $490,719, approximately $182 per square foot. 1434 W Downer Place is a home located in Kane County with nearby schools including Freeman Elementary School, Washington Middle School, and West Aurora High School.
Ownership History
Date
Name
Owned For
Owner Type
Purchase Details
Closed on
Dec 29, 2006
Sold by
Brady Kevin R and Brady Laura M
Bought by
Klock James P and Klock Lori A
Current Estimated Value
Home Financials for this Owner
Home Financials are based on the most recent Mortgage that was taken out on this home.
Original Mortgage
$230,000
Outstanding Balance
$137,677
Interest Rate
6.24%
Mortgage Type
Purchase Money Mortgage
Estimated Equity
$353,042
Purchase Details
Closed on
May 10, 2000
Sold by
Hepp James P and Hepp Katherine J
Bought by
Brady Kevin R and Brady Laura M
Home Financials for this Owner
Home Financials are based on the most recent Mortgage that was taken out on this home.
Original Mortgage
$175,000
Interest Rate
8.26%
Purchase Details
Closed on
May 30, 1997
Sold by
Reyling Gerald G and Keeler Donna H
Bought by
Hepp James P and Hepp Katherine J
Home Financials for this Owner
Home Financials are based on the most recent Mortgage that was taken out on this home.
Original Mortgage
$150,000
Interest Rate
8.17%
Mortgage Type
Balloon
Create a Home Valuation Report for This Property
The Home Valuation Report is an in-depth analysis detailing your home's value as well as a comparison with similar homes in the area
Home Values in the Area
Average Home Value in this Area
Purchase History
| Date | Buyer | Sale Price | Title Company |
|---|---|---|---|
| Klock James P | $350,000 | Ticor Title Insurance Co | |
| Brady Kevin R | $235,000 | Law Title Insurance Co Inc | |
| Hepp James P | $210,000 | First American Title Ins Co |
Source: Public Records
Mortgage History
| Date | Status | Borrower | Loan Amount |
|---|---|---|---|
| Open | Klock James P | $230,000 | |
| Previous Owner | Brady Kevin R | $175,000 | |
| Previous Owner | Hepp James P | $150,000 |
Source: Public Records
Tax History Compared to Growth
Tax History
| Year | Tax Paid | Tax Assessment Tax Assessment Total Assessment is a certain percentage of the fair market value that is determined by local assessors to be the total taxable value of land and additions on the property. | Land | Improvement |
|---|---|---|---|---|
| 2024 | $12,710 | $168,516 | $31,000 | $137,516 |
| 2023 | $12,212 | $150,568 | $27,698 | $122,870 |
| 2022 | $11,630 | $137,380 | $25,272 | $112,108 |
| 2021 | $11,137 | $127,903 | $23,529 | $104,374 |
| 2020 | $11,434 | $128,134 | $21,855 | $106,279 |
| 2019 | $11,022 | $118,719 | $20,249 | $98,470 |
| 2018 | $10,714 | $113,322 | $18,730 | $94,592 |
| 2017 | $11,100 | $113,855 | $17,258 | $96,597 |
| 2016 | $9,936 | $99,529 | $14,793 | $84,736 |
| 2015 | -- | $83,196 | $12,721 | $70,475 |
| 2014 | -- | $101,809 | $11,691 | $90,118 |
| 2013 | -- | $100,595 | $11,760 | $88,835 |
Source: Public Records
Map
Nearby Homes
- 231 W Downer Place
- 1543 W Downer Place
- 149 S Gladstone Ave
- 164 S Calumet Ave
- 203 S Calumet Ave
- 113 Stonewood Place Unit 6D
- 1730 W Galena Blvd Unit 402E
- 1735 Greene Ct
- 1751 Greene Ct
- 237 Ingleside Ave
- 931 W Downer Place
- 930 W New York St Unit 932
- 943 Charles St
- 175 S Harrison Ave
- 850 W Galena Blvd
- 425 Ingleside Ave
- 900 Charles St
- 1351 Monomoy St Unit D
- 1389 Monomoy St Unit B2
- 833 N Randall Rd Unit C4
- 1440 W Downer Place
- 1431 Garfield Ave
- 1437 Garfield Ave
- 1448 W Downer Place
- 1420 W Downer Place
- 1445 Garfield Ave
- 1421 Garfield Ave
- 1431 W Downer Place
- 1412 W Downer Place
- 1439 W Downer Place
- 1445 W Downer Place
- 1411 Garfield Ave
- 1504 W Downer Place
- 1421 W Downer Place
- 21 S Glenwood Place
- 1402 W Downer Place
- 1415 W Downer Place
- 1505 Garfield Ave
- 24 S Evanslawn Ave
- 1510 W Downer Place