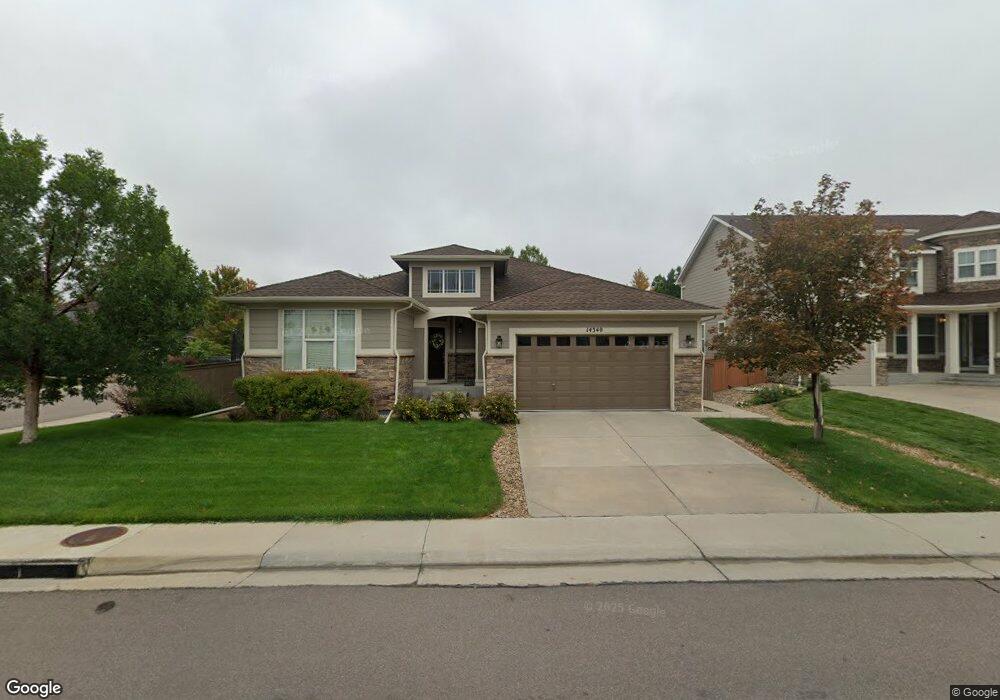
14340 Fillmore St Thornton, CO 80602
Fallbrook Farms NeighborhoodEstimated Value: $667,000 - $874,000
4
Beds
3
Baths
3,226
Sq Ft
$231/Sq Ft
Est. Value
About This Home
This home is located at 14340 Fillmore St, Thornton, CO 80602 and is currently estimated at $744,229, approximately $230 per square foot. 14340 Fillmore St is a home located in Adams County with nearby schools including Prairie Hills Elementary School, Rocky Top Middle School, and Horizon High School.
Ownership History
Date
Name
Owned For
Owner Type
Purchase Details
Closed on
Jan 11, 2013
Sold by
Altenburg Cory and Worman Kristi
Bought by
Altenburg Cory and Altenburg Kristi
Current Estimated Value
Home Financials for this Owner
Home Financials are based on the most recent Mortgage that was taken out on this home.
Original Mortgage
$338,000
Outstanding Balance
$64,288
Interest Rate
3.34%
Mortgage Type
New Conventional
Estimated Equity
$679,941
Purchase Details
Closed on
Nov 16, 2009
Sold by
Themigroup Inc
Bought by
Altenburg Cory and Worman Kristi
Home Financials for this Owner
Home Financials are based on the most recent Mortgage that was taken out on this home.
Original Mortgage
$358,290
Interest Rate
4.83%
Mortgage Type
FHA
Purchase Details
Closed on
Mar 23, 2007
Sold by
Meritage Homes Of Colorado Inc
Bought by
Copelin Kass A and Copelin Brooke R
Home Financials for this Owner
Home Financials are based on the most recent Mortgage that was taken out on this home.
Original Mortgage
$319,960
Interest Rate
6.24%
Mortgage Type
Purchase Money Mortgage
Create a Home Valuation Report for This Property
The Home Valuation Report is an in-depth analysis detailing your home's value as well as a comparison with similar homes in the area
Home Values in the Area
Average Home Value in this Area
Purchase History
| Date | Buyer | Sale Price | Title Company |
|---|---|---|---|
| Altenburg Cory | -- | Fidelity National Title Insu | |
| Altenburg Cory | $364,900 | Chicago Title Co | |
| The Migroup Inc | $364,900 | None Available | |
| Copelin Kass A | $336,800 | Security Title |
Source: Public Records
Mortgage History
| Date | Status | Borrower | Loan Amount |
|---|---|---|---|
| Open | Altenburg Cory | $338,000 | |
| Closed | Altenburg Cory | $358,290 | |
| Previous Owner | Copelin Kass A | $319,960 |
Source: Public Records
Tax History Compared to Growth
Tax History
| Year | Tax Paid | Tax Assessment Tax Assessment Total Assessment is a certain percentage of the fair market value that is determined by local assessors to be the total taxable value of land and additions on the property. | Land | Improvement |
|---|---|---|---|---|
| 2024 | $4,460 | $41,570 | $7,630 | $33,940 |
| 2023 | $4,415 | $46,810 | $8,250 | $38,560 |
| 2022 | $5,565 | $35,370 | $8,480 | $26,890 |
| 2021 | $5,565 | $35,370 | $8,480 | $26,890 |
| 2020 | $5,713 | $37,120 | $8,720 | $28,400 |
| 2019 | $5,721 | $37,120 | $8,720 | $28,400 |
| 2018 | $5,482 | $34,830 | $7,920 | $26,910 |
| 2017 | $5,119 | $34,830 | $7,920 | $26,910 |
| 2016 | $4,336 | $28,870 | $5,570 | $23,300 |
| 2015 | $4,338 | $28,870 | $5,570 | $23,300 |
| 2014 | $4,663 | $28,400 | $4,940 | $23,460 |
Source: Public Records
Map
Nearby Homes
- 14447 Madison St
- 3365 E 141st Ave
- 2705 E 148th Dr
- 13845 Adams Cir
- 13890 Madison St
- 14065 Harrison St
- 14558 Vine St
- 14028 Jackson St
- 2028 E 145th Ave
- 14725 Gaylord St
- 1936 E 144th Dr
- 1920 E 145th Ave
- 14928 Clayton St
- 13758 Cook St
- 14747 Race St
- 13844 Jackson St
- 4225 E 145 Ave
- 14985 Elizabeth St
- 14959 Harrison St
- 13638 Garfield St Unit C
- 14330 Fillmore St
- 3012 E 143rd Place
- 14320 Fillmore St
- 2909 E 143rd Place
- 3022 E 143rd Place
- 2959 E 143rd Place
- 3007 E 143rd Ave
- 14339 Fillmore St
- 14329 Fillmore St
- 3021 E 143rd Place
- 3027 E 143rd Ave
- 14349 Fillmore St
- 14319 Fillmore St
- 3032 E 143rd Place
- 2944 E 143rd Dr
- 3031 E 143rd Place
- 14359 Fillmore St
- 3037 E 143rd Ave
- 14309 Fillmore St
- 2984 E 143rd Dr