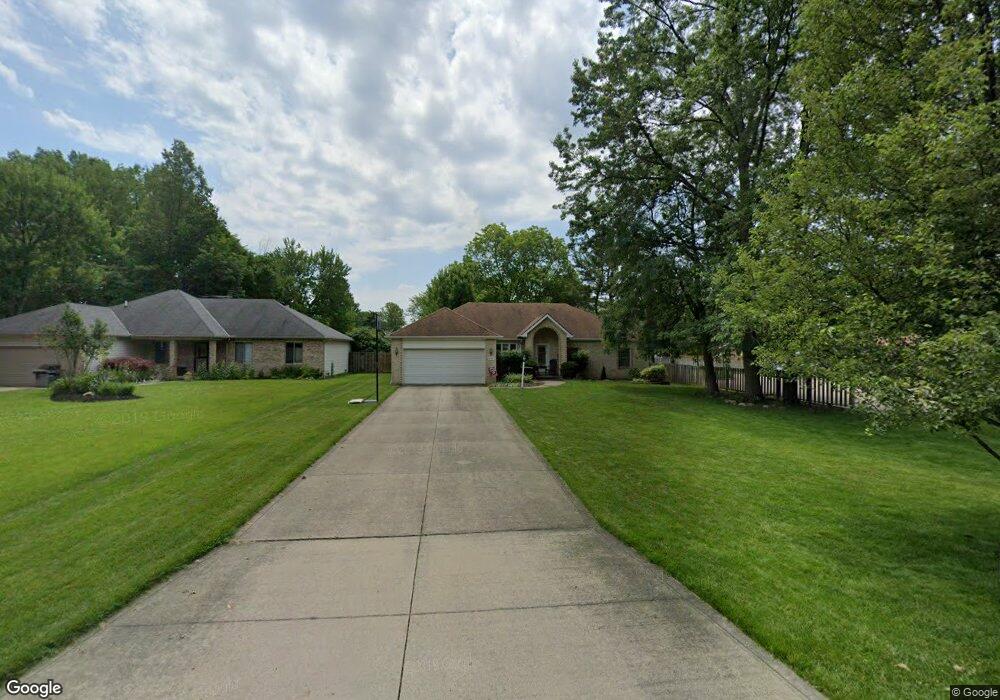
14341 Claremont Ave Middleburg Heights, OH 44130
Estimated Value: $316,000 - $373,223
3
Beds
3
Baths
1,906
Sq Ft
$182/Sq Ft
Est. Value
About This Home
This home is located at 14341 Claremont Ave, Middleburg Heights, OH 44130 and is currently estimated at $347,556, approximately $182 per square foot. 14341 Claremont Ave is a home located in Cuyahoga County with nearby schools including Big Creek Elementary School, Berea-Midpark Middle School, and Berea-Midpark High School.
Ownership History
Date
Name
Owned For
Owner Type
Purchase Details
Closed on
Nov 14, 1998
Sold by
Republic Construction Consultants Inc
Bought by
Czarnecki Robert A and Czarnecki Michelle M
Current Estimated Value
Purchase Details
Closed on
Jul 27, 1998
Sold by
Republic Construction Consultants Inc
Bought by
Zinicola Domenico and Zinicola Anaida
Home Financials for this Owner
Home Financials are based on the most recent Mortgage that was taken out on this home.
Original Mortgage
$125,000
Interest Rate
7.03%
Purchase Details
Closed on
Mar 19, 1998
Sold by
Zinicola Raymond
Bought by
Zinicola Domenic
Purchase Details
Closed on
Mar 12, 1998
Sold by
Zinicola Domenic
Bought by
Republic Construction Consultans Inc
Purchase Details
Closed on
Dec 4, 1997
Sold by
Hutchinson David
Bought by
Zinicola Domenic and Zinicola Raymond
Create a Home Valuation Report for This Property
The Home Valuation Report is an in-depth analysis detailing your home's value as well as a comparison with similar homes in the area
Home Values in the Area
Average Home Value in this Area
Purchase History
| Date | Buyer | Sale Price | Title Company |
|---|---|---|---|
| Czarnecki Robert A | $199,000 | -- | |
| Zinicola Domenico | -- | -- | |
| Zinicola Domenic | -- | -- | |
| Republic Construction Consultans Inc | $37,500 | -- | |
| Zinicola Domenic | $75,000 | -- |
Source: Public Records
Mortgage History
| Date | Status | Borrower | Loan Amount |
|---|---|---|---|
| Previous Owner | Zinicola Domenico | $125,000 |
Source: Public Records
Tax History Compared to Growth
Tax History
| Year | Tax Paid | Tax Assessment Tax Assessment Total Assessment is a certain percentage of the fair market value that is determined by local assessors to be the total taxable value of land and additions on the property. | Land | Improvement |
|---|---|---|---|---|
| 2024 | $5,870 | $108,360 | $24,255 | $84,105 |
| 2023 | $6,150 | $94,330 | $14,980 | $79,350 |
| 2022 | $6,110 | $94,330 | $14,980 | $79,350 |
| 2021 | $6,076 | $94,330 | $14,980 | $79,350 |
| 2020 | $5,774 | $78,610 | $12,500 | $66,120 |
| 2019 | $5,614 | $224,600 | $35,700 | $188,900 |
| 2018 | $5,359 | $78,610 | $12,500 | $66,120 |
| 2017 | $5,518 | $71,580 | $10,120 | $61,460 |
| 2016 | $5,475 | $71,580 | $10,120 | $61,460 |
| 2015 | $5,164 | $71,580 | $10,120 | $61,460 |
| 2014 | $5,164 | $71,580 | $10,120 | $61,460 |
Source: Public Records
Map
Nearby Homes
- 6771 Wood Creek Dr
- 6566 Elmdale Rd
- 6943 N Parkway Dr Unit H6943
- 13689 Pineview Ct
- 6749 Middlebrook Blvd
- 6359 Middlebrook Blvd
- 15510 Sandalhaven Dr
- 13879 Zaremba Dr
- 13931 Franklyn Blvd
- 6491 Smith Rd
- 15446 Sheldon Rd
- 6736 Rockridge Ct
- 6710 Woodruff Ct
- 13971 Park Dr
- 6212 Elmdale Rd
- 6736 Columbine Ct
- 6809 Meadow Ln
- 15983 Galemore Dr
- 6330 Michael Dr
- 6470 Sandfield Dr
- 14331 Claremont Ave
- 6819 Smith Rd
- 14283 Claremont Ave
- 6815 Smith Rd
- 14350 Claremont Ave
- 6825 Smith Rd
- 14279 Claremont Ave
- 6805 Smith Rd
- 14330 Claremont Ave
- 14290 Claremont Ave
- S/L 16 St Andrews Ct
- SL/ 4 St Andrews Ct
- 6829 Smith Rd
- 14250 Claremont Ave
- 14191 Claremont Ave
- 6801 Smith Rd
- S/L 15 St Andrews Ct
- S/L 17 St Andrews Ct
- S/L 1 St Andrews Ct
- 6773 Paula Dr