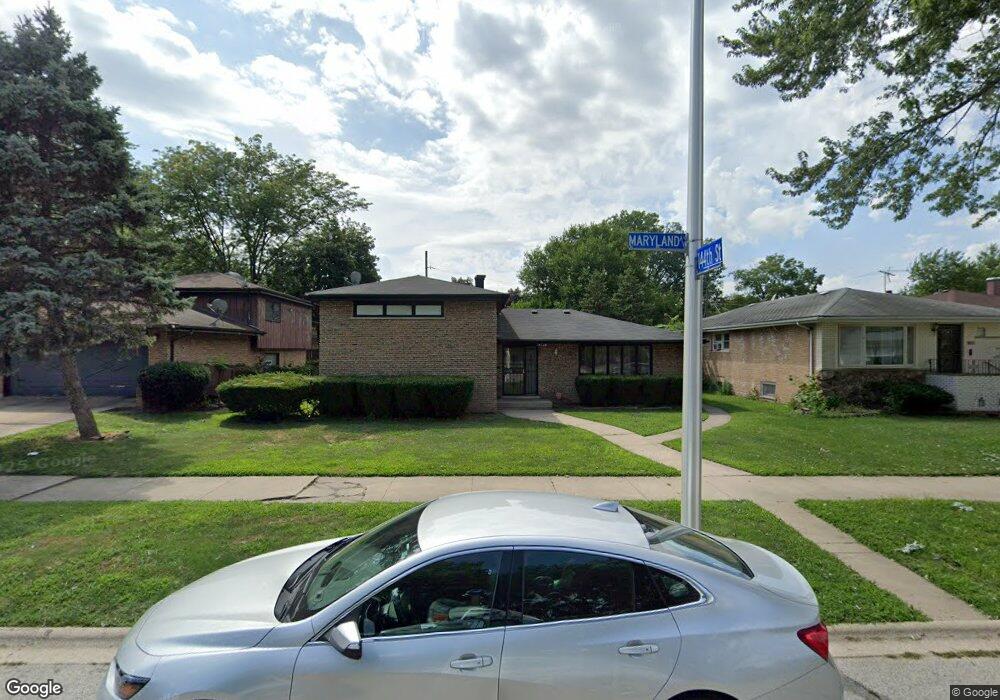
14348 Maryland Ave Dolton, IL 60419
Estimated Value: $192,723 - $256,000
3
Beds
2
Baths
1,472
Sq Ft
$150/Sq Ft
Est. Value
About This Home
This home is located at 14348 Maryland Ave, Dolton, IL 60419 and is currently estimated at $220,431, approximately $149 per square foot. 14348 Maryland Ave is a home located in Cook County with nearby schools including Lincoln Elementary School, Lincoln Junior High School, and Thornridge High School.
Ownership History
Date
Name
Owned For
Owner Type
Purchase Details
Closed on
Sep 2, 2016
Sold by
Mccray Bruce
Bought by
Scott William H
Current Estimated Value
Home Financials for this Owner
Home Financials are based on the most recent Mortgage that was taken out on this home.
Original Mortgage
$133,394
Interest Rate
3.87%
Mortgage Type
FHA
Purchase Details
Closed on
Oct 6, 2015
Sold by
Keys Ricketia
Bought by
Mccray Bruce
Purchase Details
Closed on
Feb 1, 2010
Sold by
Chicago Title Land Trust Company
Bought by
Swan Ricketia
Home Financials for this Owner
Home Financials are based on the most recent Mortgage that was taken out on this home.
Original Mortgage
$121,827
Interest Rate
5.03%
Mortgage Type
New Conventional
Purchase Details
Closed on
Aug 3, 2009
Sold by
Aurora Loan Services Llc
Bought by
Chicago Title Land Trust #17435
Purchase Details
Closed on
Apr 21, 2009
Sold by
Smith Orlando and Hargrove Smith Denise
Bought by
Aurora Loan Services Llc
Create a Home Valuation Report for This Property
The Home Valuation Report is an in-depth analysis detailing your home's value as well as a comparison with similar homes in the area
Home Values in the Area
Average Home Value in this Area
Purchase History
| Date | Buyer | Sale Price | Title Company |
|---|---|---|---|
| Scott William H | $138,000 | None Available | |
| Mccray Bruce | $26,000 | Attorney | |
| Swan Ricketia | $118,000 | Chicago Title Land Trust Co | |
| Chicago Title Land Trust #17435 | $40,000 | Multiple | |
| Aurora Loan Services Llc | -- | None Available |
Source: Public Records
Mortgage History
| Date | Status | Borrower | Loan Amount |
|---|---|---|---|
| Previous Owner | Scott William H | $133,394 | |
| Previous Owner | Swan Ricketia | $121,827 |
Source: Public Records
Tax History Compared to Growth
Tax History
| Year | Tax Paid | Tax Assessment Tax Assessment Total Assessment is a certain percentage of the fair market value that is determined by local assessors to be the total taxable value of land and additions on the property. | Land | Improvement |
|---|---|---|---|---|
| 2024 | $3,718 | $7,311 | $1,739 | $5,572 |
| 2023 | $3,604 | $7,311 | $1,739 | $5,572 |
| 2022 | $3,604 | $5,960 | $1,535 | $4,425 |
| 2021 | $3,599 | $5,959 | $1,534 | $4,425 |
| 2020 | $3,491 | $5,959 | $1,534 | $4,425 |
| 2019 | $4,101 | $6,393 | $1,432 | $4,961 |
| 2018 | $3,975 | $6,393 | $1,432 | $4,961 |
| 2017 | $5,116 | $6,393 | $1,432 | $4,961 |
| 2016 | $3,361 | $5,833 | $1,329 | $4,504 |
| 2015 | $3,213 | $5,833 | $1,329 | $4,504 |
| 2014 | $3,208 | $5,833 | $1,329 | $4,504 |
| 2013 | $3,594 | $6,857 | $1,329 | $5,528 |
Source: Public Records
Map
Nearby Homes
- 14418 Drexel Ave
- 14400 Shepard Dr
- 14333 Drexel Ave
- 14508 Ingleside Ave
- 14408 Lincoln Ave
- 14526 Cottage Grove Ave
- 14421 Murray Ave
- 14325 Ingleside Ave
- 14635 Greenwood Rd Unit B103
- 14640 Ingleside Ave
- 14647 Greenwood Rd Unit A312
- 14320 Dobson Ave
- 14411 Irving Ave
- 14221 Ingleside Ave
- 14502 Irving Ave
- 14429 Minerva Ave
- 933 E 142nd St
- 14326 Irving Ave
- 14644 Ellis Ave
- 14234 Minerva Ave
- 14348 Maryland Ave
- 14400 Maryland Ave
- 14346 Maryland Ave
- 14342 Maryland Ave
- 14340 Maryland Ave
- 14345 Cottage Grove Ave
- 14400 Shepard Dr
- 14336 Maryland Ave
- 14401 Maryland Ave
- 14414 Shepard Dr
- 14343 Cottage Grove Ave
- 14347 Maryland Ave
- 14405 Maryland Ave
- 14343 Maryland Ave
- 14332 Maryland Ave
- 14341 S Cottage Grove Ave
- 14415 Maryland Ave
- 14415 Maryland Ave
- 14339 Cottage Grove Ave