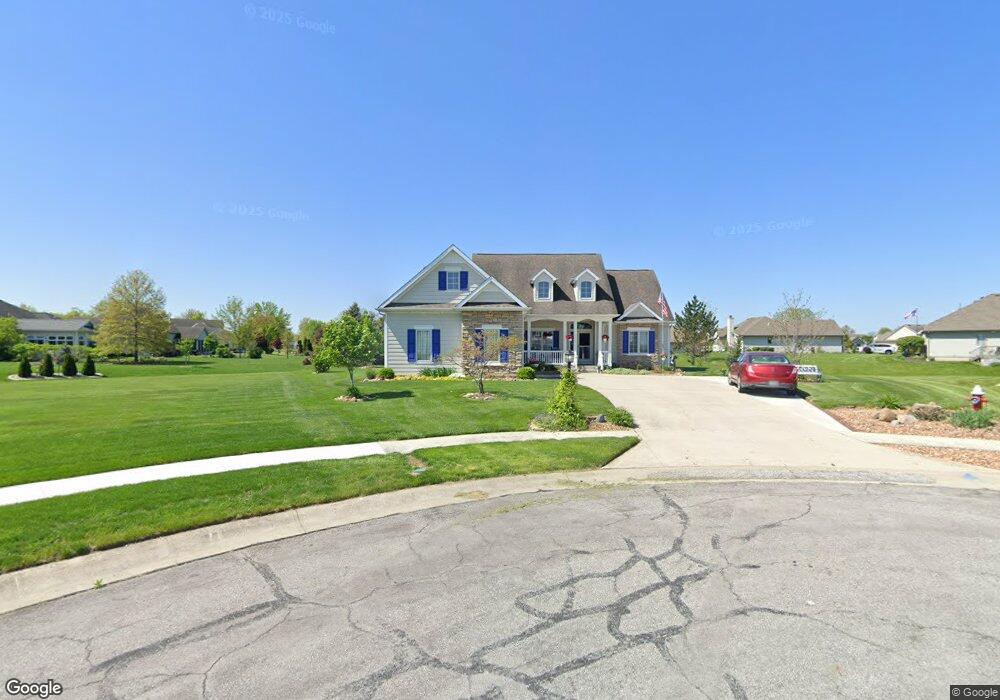
1435 Avalon Ct Defiance, OH 43512
Estimated Value: $312,880 - $341,000
3
Beds
2
Baths
1,818
Sq Ft
$181/Sq Ft
Est. Value
About This Home
This home is located at 1435 Avalon Ct, Defiance, OH 43512 and is currently estimated at $328,470, approximately $180 per square foot. 1435 Avalon Ct is a home located in Defiance County with nearby schools including Defiance Elementary School, Defiance Middle School, and Defiance High School.
Ownership History
Date
Name
Owned For
Owner Type
Purchase Details
Closed on
Apr 24, 2014
Sold by
Scott Dennis J and Scott Carolyn H
Bought by
Scott Carolyn H
Current Estimated Value
Purchase Details
Closed on
Jul 7, 2008
Sold by
Saad Michael W and Khachouf Lina
Bought by
Scott Dennis J and Scott Carolyn H
Home Financials for this Owner
Home Financials are based on the most recent Mortgage that was taken out on this home.
Original Mortgage
$80,000
Interest Rate
5.96%
Mortgage Type
Unknown
Purchase Details
Closed on
Apr 22, 2005
Sold by
D L & J Inc
Bought by
Slattery Builders
Home Financials for this Owner
Home Financials are based on the most recent Mortgage that was taken out on this home.
Original Mortgage
$156,800
Outstanding Balance
$81,493
Interest Rate
5.89%
Mortgage Type
Credit Line Revolving
Estimated Equity
$246,977
Create a Home Valuation Report for This Property
The Home Valuation Report is an in-depth analysis detailing your home's value as well as a comparison with similar homes in the area
Home Values in the Area
Average Home Value in this Area
Purchase History
| Date | Buyer | Sale Price | Title Company |
|---|---|---|---|
| Scott Carolyn H | -- | None Available | |
| Scott Dennis J | $138,750 | -- | |
| Slattery Builders | $19,875 | None Available |
Source: Public Records
Mortgage History
| Date | Status | Borrower | Loan Amount |
|---|---|---|---|
| Closed | Scott Dennis J | $80,000 | |
| Open | Slattery Builders | $156,800 |
Source: Public Records
Tax History
| Year | Tax Paid | Tax Assessment Tax Assessment Total Assessment is a certain percentage of the fair market value that is determined by local assessors to be the total taxable value of land and additions on the property. | Land | Improvement |
|---|---|---|---|---|
| 2024 | $3,551 | $103,320 | $7,160 | $96,160 |
| 2023 | $3,512 | $103,320 | $7,160 | $96,160 |
| 2022 | $2,829 | $76,050 | $7,160 | $68,890 |
| 2021 | $2,829 | $76,050 | $7,160 | $68,890 |
| 2020 | $2,851 | $76,050 | $7,160 | $68,890 |
| 2019 | $2,807 | $73,540 | $7,150 | $66,390 |
| 2018 | $2,730 | $73,540 | $7,150 | $66,390 |
| 2017 | $2,693 | $73,542 | $7,154 | $66,388 |
| 2016 | $2,700 | $71,774 | $5,288 | $66,486 |
| 2015 | $1,450 | $70,917 | $5,288 | $65,629 |
| 2014 | $1,450 | $70,329 | $5,288 | $65,041 |
| 2013 | $1,450 | $70,329 | $5,288 | $65,041 |
| 2012 | $1,450 | $70,330 | $5,289 | $65,041 |
Source: Public Records
Map
Nearby Homes
- 2021 S Clinton St
- 1582 S Clinton St
- 1581 Westgate Dr
- 1572 S Clinton St
- 1502 Westgate Dr
- 1494 Westgate Dr
- 1500 Lee Ann Ave
- Integrity 2190 Plan at Plummer Second Addition
- Elements 2390 Plan at Plummer Second Addition
- Integrity 1610 Plan at Plummer Second Addition
- Integrity 1530 Plan at Plummer Second Addition
- Elements 2700 Plan at Plummer Second Addition
- integrity 2280 Plan at Plummer Second Addition
- Integrity 2061 V8.1a Plan at Plummer Second Addition
- Elements 2200 Plan at Plummer Second Addition
- Integrity 2060 Plan at Plummer Second Addition
- Integrity 1605 Plan at Plummer Second Addition
- 1481 Lee Ann Ave
- 1473 Lee Ann Ave
- 1461 Lee Ann Ave
- 1425 Avalon Ct
- 1440 Avalon Ct
- 1455 Newport Cove
- 1880 Langlan Dr
- 1465 Newport Cove
- 1860 Langlan Dr
- 1415 Avalon Ct
- 1840 Langlan Dr
- 1935 Waterford Ln
- 1900 Langlan Dr
- 1915 Waterford Ln
- 1450 Newport Cove
- 1420 Avalon Ct
- 1905 Waterford Ln
- 1410 Avalon Ct
- 1865 Langlan Dr
- 1460 Newport Cove
- 1940 Waterford Ln
- 1835 Langlan Dr
- 1 Kiser Rd
Your Personal Tour Guide
Ask me questions while you tour the home.