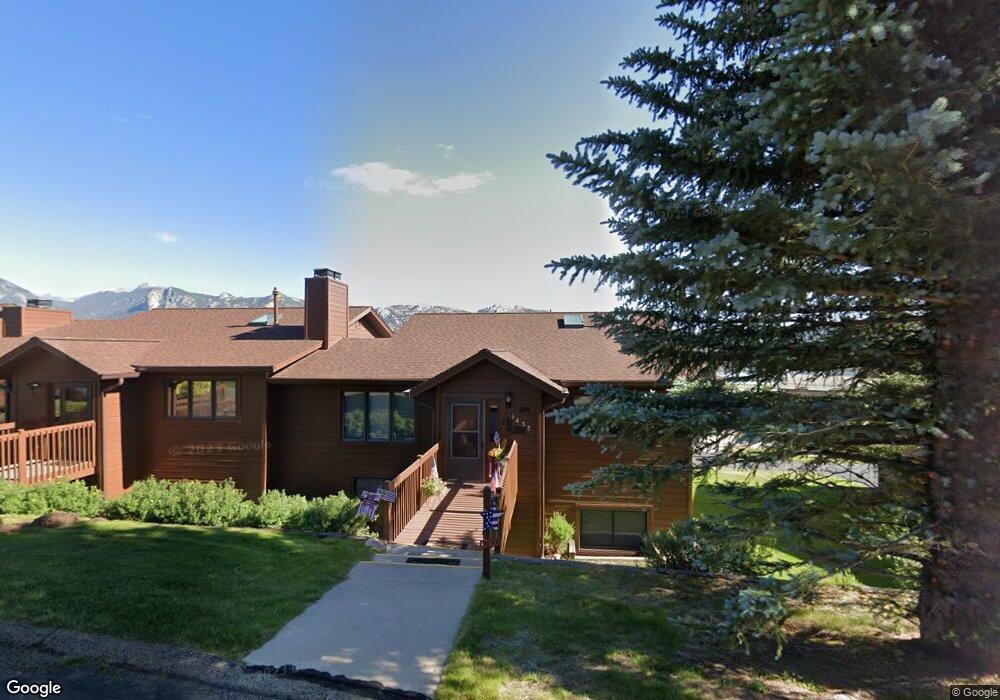
1435 Matthew Cir Unit K2 Estes Park, CO 80517
Estimated Value: $659,455 - $742,000
3
Beds
2
Baths
1,410
Sq Ft
$498/Sq Ft
Est. Value
About This Home
This home is located at 1435 Matthew Cir Unit K2, Estes Park, CO 80517 and is currently estimated at $701,864, approximately $497 per square foot. 1435 Matthew Cir Unit K2 is a home located in Larimer County with nearby schools including Estes Park K-5 School, Estes Park Options School, and Estes Park Middle School.
Ownership History
Date
Name
Owned For
Owner Type
Purchase Details
Closed on
Aug 20, 2013
Sold by
Dykes B W and Dykes Sue Ann
Bought by
Larue Ronald G and Larue Colleen J
Current Estimated Value
Home Financials for this Owner
Home Financials are based on the most recent Mortgage that was taken out on this home.
Original Mortgage
$200,000
Outstanding Balance
$49,731
Interest Rate
4.36%
Mortgage Type
New Conventional
Estimated Equity
$652,133
Purchase Details
Closed on
Apr 19, 2001
Sold by
Dykes Sue and Dykes B
Bought by
Dykes B W and Dykes Sue Ann
Purchase Details
Closed on
Mar 12, 2001
Sold by
Dykes B W and Dykes Sue Ann
Bought by
Dykes Sue and Dykes B
Purchase Details
Closed on
Sep 3, 1999
Sold by
Harrod Rick N and Harrod Alice J
Bought by
Dykes B W and Dykes Sue Ann
Home Financials for this Owner
Home Financials are based on the most recent Mortgage that was taken out on this home.
Original Mortgage
$204,750
Interest Rate
7.68%
Purchase Details
Closed on
Oct 1, 1995
Sold by
Mountain Fairways Joint Venture
Bought by
Harrod Rick N
Create a Home Valuation Report for This Property
The Home Valuation Report is an in-depth analysis detailing your home's value as well as a comparison with similar homes in the area
Home Values in the Area
Average Home Value in this Area
Purchase History
| Date | Buyer | Sale Price | Title Company |
|---|---|---|---|
| Larue Ronald G | $350,000 | Fidelity National Title Insu | |
| Dykes B W | -- | -- | |
| Dykes Sue | -- | -- | |
| Dykes B W | $227,500 | Security Title | |
| Harrod Rick N | $184,000 | -- |
Source: Public Records
Mortgage History
| Date | Status | Borrower | Loan Amount |
|---|---|---|---|
| Open | Larue Ronald G | $200,000 | |
| Previous Owner | Dykes B W | $204,750 |
Source: Public Records
Tax History Compared to Growth
Tax History
| Year | Tax Paid | Tax Assessment Tax Assessment Total Assessment is a certain percentage of the fair market value that is determined by local assessors to be the total taxable value of land and additions on the property. | Land | Improvement |
|---|---|---|---|---|
| 2025 | $3,232 | $47,811 | $4,690 | $43,121 |
| 2024 | $3,177 | $47,811 | $4,690 | $43,121 |
| 2022 | $2,386 | $31,240 | $4,865 | $26,375 |
| 2021 | $2,449 | $32,139 | $5,005 | $27,134 |
| 2020 | $2,349 | $30,430 | $5,005 | $25,425 |
| 2019 | $2,336 | $30,430 | $5,005 | $25,425 |
| 2018 | $2,172 | $27,446 | $5,040 | $22,406 |
| 2017 | $2,184 | $27,446 | $5,040 | $22,406 |
| 2016 | $2,165 | $28,839 | $5,572 | $23,267 |
| 2015 | $2,188 | $28,840 | $5,570 | $23,270 |
| 2014 | $1,793 | $24,240 | $2,930 | $21,310 |
Source: Public Records
Map
Nearby Homes
- 1443 Matthew Cir Unit L3
- 1422 Matthew Cir Unit 2
- 635 Community Dr
- 704 Birdie Ln Unit 17
- 734 Birdie Ln Unit 15
- 850 Shady Ln
- 910 Shady Ln
- TBD Stanley Ave
- 1050 S Saint Vrain Ave Unit 1
- 1013 Lexington Ln
- 1111 Fairway Club Cir Unit 4
- 659 Morgan St
- 1141 Fairway Club Cir Unit C3
- 1132 Fairway Club Ln Unit 2
- 654 Morgan St
- 1026 Lexington Ln
- 1155 S Saint Vrain Ave Unit 1-3
- 1155 S Saint Vrain Ave Unit 3
- 830 Morgan St
- 261 South Ct
- 1433 Matthew Cir Unit K1
- 1433 Matthew Cir Unit 1
- 1431 Matthew Cir Unit J3
- 1431 Matthew Cir Unit 3
- 1441 Matthew Cir Unit L2
- 1421 Matthew Cir Unit J
- 1421 Matthew Cir Unit 2
- 1438 Matthew Cir Unit C3
- 1438 Matthew Cir Unit 3
- 1434 Matthew Cir Unit C1
- 1440 Matthew Cir Unit G1
- 1440 Matthew Cir Unit 1
- 1411 Matthew Cir Unit J1
- 1411 Matthew Cir Unit 1
- 1442 Matthew Cir Unit G2
- 1422 Matthew Cir Unit B2
- 1410 Matthew Cir Unit B1
- 1410 Matthew Cir Unit 1
- 1447 Matthew Cir Unit F1
- 1445 Matthew Cir Unit F2