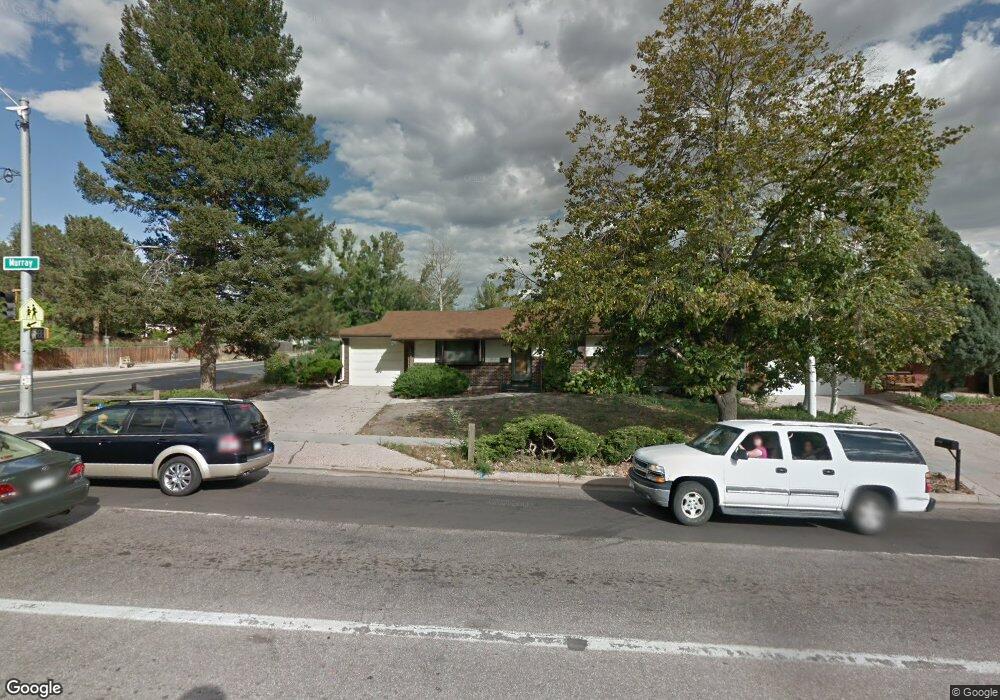
1435 N Murray Blvd Colorado Springs, CO 80915
Rustic Hills NeighborhoodEstimated Value: $366,236 - $397,000
4
Beds
3
Baths
1,196
Sq Ft
$320/Sq Ft
Est. Value
About This Home
This home is located at 1435 N Murray Blvd, Colorado Springs, CO 80915 and is currently estimated at $382,809, approximately $320 per square foot. 1435 N Murray Blvd is a home located in El Paso County with nearby schools including Wilson Elementary School, Sabin Middle School, and Mitchell High School.
Ownership History
Date
Name
Owned For
Owner Type
Purchase Details
Closed on
Jul 25, 2008
Sold by
Cosden Linda R and Leek Joann
Bought by
Rothenberger Dennis
Current Estimated Value
Home Financials for this Owner
Home Financials are based on the most recent Mortgage that was taken out on this home.
Original Mortgage
$116,800
Interest Rate
6.36%
Mortgage Type
Unknown
Purchase Details
Closed on
Jun 9, 2008
Sold by
Pech Randy M
Bought by
Cosden Linda R and Leek Joann
Home Financials for this Owner
Home Financials are based on the most recent Mortgage that was taken out on this home.
Original Mortgage
$116,800
Interest Rate
6.36%
Mortgage Type
Unknown
Purchase Details
Closed on
Dec 17, 2004
Sold by
Pech Ruth E
Bought by
The Ruth E Pech Revocable Trust
Purchase Details
Closed on
Jul 23, 1998
Sold by
Pech Ruth E
Bought by
Pech Ruth E and Leek Joann
Create a Home Valuation Report for This Property
The Home Valuation Report is an in-depth analysis detailing your home's value as well as a comparison with similar homes in the area
Home Values in the Area
Average Home Value in this Area
Purchase History
| Date | Buyer | Sale Price | Title Company |
|---|---|---|---|
| Rothenberger Dennis | $146,000 | Unified Title Company | |
| Cosden Linda R | -- | None Available | |
| The Ruth E Pech Revocable Trust | -- | -- | |
| Pech Ruth E | -- | -- | |
| Pech Ruth E | -- | -- |
Source: Public Records
Mortgage History
| Date | Status | Borrower | Loan Amount |
|---|---|---|---|
| Closed | Rothenberger Dennis | $116,800 |
Source: Public Records
Tax History Compared to Growth
Tax History
| Year | Tax Paid | Tax Assessment Tax Assessment Total Assessment is a certain percentage of the fair market value that is determined by local assessors to be the total taxable value of land and additions on the property. | Land | Improvement |
|---|---|---|---|---|
| 2025 | $1,409 | $28,300 | -- | -- |
| 2024 | $1,295 | $29,770 | $4,150 | $25,620 |
| 2023 | $1,295 | $29,770 | $4,150 | $25,620 |
| 2022 | $1,022 | $18,260 | $3,340 | $14,920 |
| 2021 | $1,108 | $18,780 | $3,430 | $15,350 |
| 2020 | $1,071 | $15,780 | $3,000 | $12,780 |
| 2019 | $1,065 | $15,780 | $3,000 | $12,780 |
| 2018 | $934 | $12,730 | $2,380 | $10,350 |
| 2017 | $885 | $12,730 | $2,380 | $10,350 |
| 2016 | $698 | $12,040 | $2,310 | $9,730 |
| 2015 | $695 | $12,040 | $2,310 | $9,730 |
| 2014 | $684 | $11,360 | $2,310 | $9,050 |
Source: Public Records
Map
Nearby Homes
- 1426 de Reamer Cir
- 1505 Mckay Way
- 1512 Keaton Ln
- 4119 Palmer Park Blvd
- 1658 Keaton Ln
- 1414 Martin Dr
- 1625 N Murray Blvd Unit 230
- 1625 N Murray Blvd Unit 142
- 1625 N Murray Blvd Unit 224
- 1625 N Murray Blvd Unit 107
- 1222 de Reamer Cir
- 1708 Sawyer Way Unit 264
- 1708 Sawyer Way Unit 178
- 1708 Sawyer Way Unit 176
- 1239 Martin Dr
- 1202 Fosdick Dr
- 1125 Moffat Cir
- 1770 Sawyer Way
- 1508 E Owen Cir
- 1501 E Owen Cir
- 1431 N Murray Blvd
- 4315 Palmer Park Blvd
- 1507 N Murray Blvd
- 1430 de Reamer Cir
- 4211 Palmer Park Blvd
- 1502 Mckay Way
- 1432 N Murray Blvd
- 1423 N Murray Blvd
- 1511 N Murray Blvd
- 1502 N Murray Blvd
- 1428 N Murray Blvd
- 1422 de Reamer Cir
- 1506 Mckay Way
- 1419 N Murray Blvd
- 1506 N Murray Blvd
- 1424 N Murray Blvd
- 1515 N Murray Blvd
- 1431 Keaton Ln
- 1427 Keaton Ln
- 1510 Mckay Way