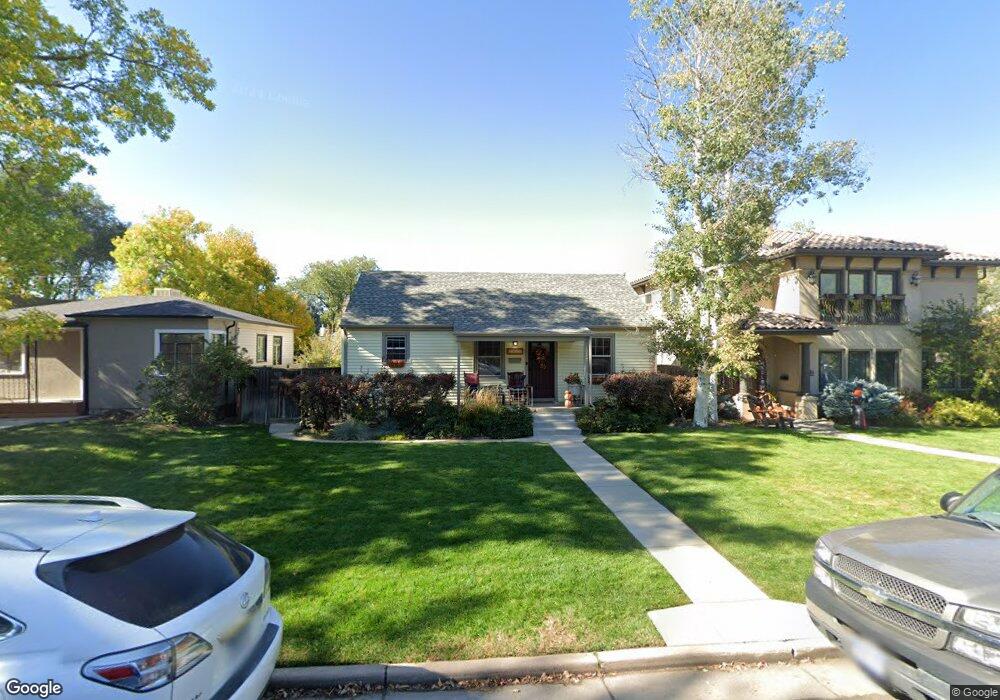
1435 S Fillmore St Denver, CO 80210
Cory-Merrill NeighborhoodEstimated Value: $646,167 - $880,000
2
Beds
2
Baths
794
Sq Ft
$946/Sq Ft
Est. Value
About This Home
This home is located at 1435 S Fillmore St, Denver, CO 80210 and is currently estimated at $751,292, approximately $946 per square foot. 1435 S Fillmore St is a home located in Denver County with nearby schools including Cory Elementary School, Merrill Middle School, and South High School.
Ownership History
Date
Name
Owned For
Owner Type
Purchase Details
Closed on
Aug 8, 2020
Sold by
Smith Philip Michael and Smith Patricia Kirby
Bought by
Smith Philip M and Smith Patricia Kirby
Current Estimated Value
Home Financials for this Owner
Home Financials are based on the most recent Mortgage that was taken out on this home.
Original Mortgage
$254,500
Interest Rate
3%
Mortgage Type
New Conventional
Purchase Details
Closed on
Jan 18, 2000
Sold by
Smith Philip M and Smith Philip Michael
Bought by
Smith Philip M and Smith Patricia Kirby
Purchase Details
Closed on
Oct 21, 1999
Sold by
Smith Philip M
Bought by
Smith Philip M
Home Financials for this Owner
Home Financials are based on the most recent Mortgage that was taken out on this home.
Original Mortgage
$185,600
Interest Rate
7.85%
Create a Home Valuation Report for This Property
The Home Valuation Report is an in-depth analysis detailing your home's value as well as a comparison with similar homes in the area
Home Values in the Area
Average Home Value in this Area
Purchase History
| Date | Buyer | Sale Price | Title Company |
|---|---|---|---|
| Smith Philip M | -- | First Integrity Title Co | |
| Smith Philip M | -- | -- | |
| Smith Philip M | -- | -- |
Source: Public Records
Mortgage History
| Date | Status | Borrower | Loan Amount |
|---|---|---|---|
| Closed | Smith Philip M | $254,500 | |
| Closed | Smith Philip M | $185,600 |
Source: Public Records
Tax History Compared to Growth
Tax History
| Year | Tax Paid | Tax Assessment Tax Assessment Total Assessment is a certain percentage of the fair market value that is determined by local assessors to be the total taxable value of land and additions on the property. | Land | Improvement |
|---|---|---|---|---|
| 2024 | $2,999 | $44,560 | $42,350 | $2,210 |
| 2023 | $2,934 | $44,560 | $42,350 | $2,210 |
| 2022 | $2,921 | $43,680 | $41,240 | $2,440 |
| 2021 | $2,921 | $44,940 | $42,430 | $2,510 |
| 2020 | $2,244 | $37,400 | $33,500 | $3,900 |
| 2019 | $2,182 | $37,400 | $33,500 | $3,900 |
| 2018 | $2,596 | $33,560 | $31,490 | $2,070 |
| 2017 | $2,589 | $33,560 | $31,490 | $2,070 |
| 2016 | $2,552 | $31,300 | $28,592 | $2,708 |
| 2015 | $2,445 | $31,300 | $28,592 | $2,708 |
| 2014 | $2,240 | $26,970 | $18,642 | $8,328 |
Source: Public Records
Map
Nearby Homes
- 1410 S Elizabeth St
- 1500 S Elizabeth St
- 1377 S Saint Paul St
- 1544 S Elizabeth St
- 1546 S Milwaukee St
- 1518 S Columbine St
- 1290 S Milwaukee St
- 1476 S Josephine St
- 1600 S Milwaukee St
- 1625 S Fillmore St
- 1624 S Elizabeth St
- 1601 S Columbine St
- 1665 S Fillmore St
- 1214 S Fillmore St
- 1520 S University Blvd
- 1352 S University Blvd
- 1208 S Elizabeth St
- 1675 S Steele St
- 1491 S York St
- 1296 S York St
- 1425 S Fillmore St
- 1441 S Fillmore St
- 1417 S Fillmore St
- 1453 S Fillmore St
- 1411 S Fillmore St
- 1457 S Fillmore St
- 1434 S Fillmore St
- 1424 S Fillmore St
- 1434 S Clayton St
- 1420 S Fillmore St
- 1426 S Clayton St
- 1450 S Fillmore St
- 1444 S Fillmore St
- 1440 S Clayton St
- 1401 S Fillmore St
- 1450 S Clayton St
- 1424 S Clayton St
- 1408 S Fillmore St
- 1465 S Fillmore St
- 1420 S Clayton St