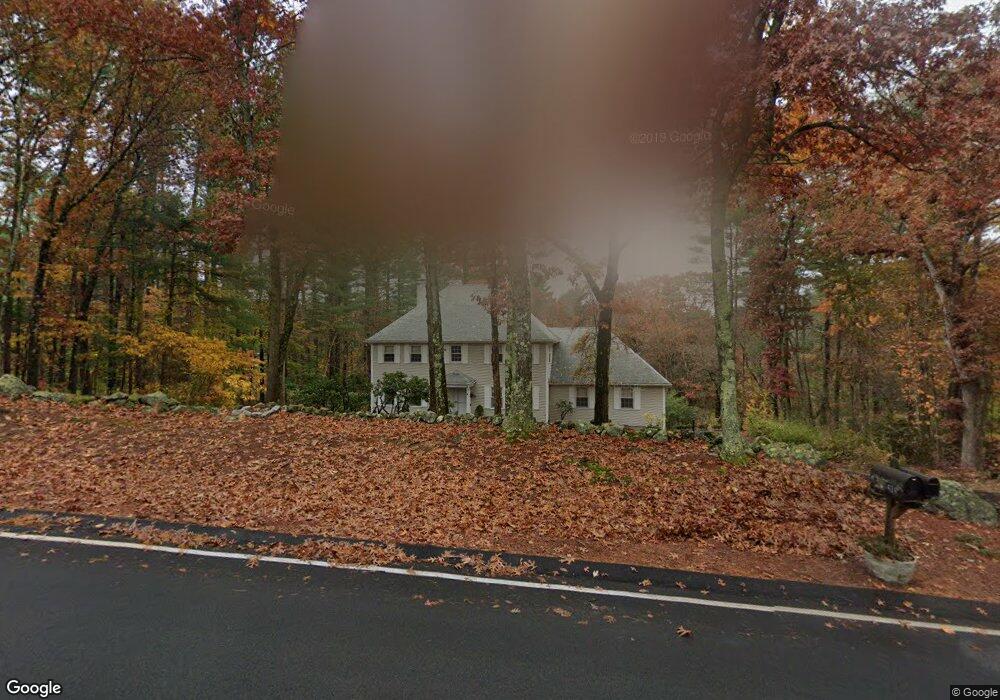
1435 Salem St North Andover, MA 01845
Estimated Value: $962,000 - $1,068,000
4
Beds
3
Baths
2,816
Sq Ft
$359/Sq Ft
Est. Value
About This Home
This home is located at 1435 Salem St, North Andover, MA 01845 and is currently estimated at $1,009,692, approximately $358 per square foot. 1435 Salem St is a home located in Essex County with nearby schools including Annie L Sargent Elementary School, North Andover Middle School, and North Andover High School.
Ownership History
Date
Name
Owned For
Owner Type
Purchase Details
Closed on
Sep 26, 2014
Sold by
Gaul Edith M
Bought by
Edith M Gaul Ret and Gaul Edith M
Current Estimated Value
Purchase Details
Closed on
Aug 26, 1982
Bought by
Edith M Gaul Ret
Create a Home Valuation Report for This Property
The Home Valuation Report is an in-depth analysis detailing your home's value as well as a comparison with similar homes in the area
Home Values in the Area
Average Home Value in this Area
Purchase History
| Date | Buyer | Sale Price | Title Company |
|---|---|---|---|
| Edith M Gaul Ret | -- | -- | |
| Edith M Gaul Ret | $157,500 | -- |
Source: Public Records
Mortgage History
| Date | Status | Borrower | Loan Amount |
|---|---|---|---|
| Previous Owner | Edith M Gaul Ret | $75,000 | |
| Previous Owner | Edith M Gaul Ret | $179,000 | |
| Previous Owner | Edith M Gaul Ret | $47,400 | |
| Previous Owner | Edith M Gaul Ret | $185,500 |
Source: Public Records
Tax History Compared to Growth
Tax History
| Year | Tax Paid | Tax Assessment Tax Assessment Total Assessment is a certain percentage of the fair market value that is determined by local assessors to be the total taxable value of land and additions on the property. | Land | Improvement |
|---|---|---|---|---|
| 2025 | $10,015 | $889,400 | $413,800 | $475,600 |
| 2024 | $9,516 | $858,100 | $392,000 | $466,100 |
| 2023 | $9,105 | $743,900 | $331,100 | $412,800 |
| 2022 | $8,831 | $652,700 | $300,600 | $352,100 |
| 2021 | $8,462 | $597,200 | $272,300 | $324,900 |
| 2020 | $8,206 | $597,200 | $272,300 | $324,900 |
| 2019 | $8,008 | $597,200 | $272,300 | $324,900 |
| 2018 | $8,677 | $597,200 | $272,300 | $324,900 |
| 2017 | $7,601 | $532,300 | $213,400 | $318,900 |
| 2016 | $7,201 | $504,600 | $212,100 | $292,500 |
| 2015 | $7,238 | $503,000 | $208,600 | $294,400 |
Source: Public Records
Map
Nearby Homes
- 10 Woodchuck Ln
- Lot 10 Stonecleave Rd
- 851 Forest St
- 7 Sullivan St
- 114 Stonecleave Rd
- 12 Farnum St
- 480 Sharpners Pond Rd
- 660 Sharpners Pond Rd
- 590 Foster St
- 50 Stonecleave Rd
- 45 Thistle Rd
- 75 Thistle Rd
- 3 Harvest Dr Unit 106
- 2 Harvest Dr Unit 301
- 3 Harvest Dr Unit 303
- 3 Harvest Dr Unit 107
- 495 Johnson St
- 53 Lawrence Rd
- Lot 2 (31) Lawrence Rd
- 378 Salem St