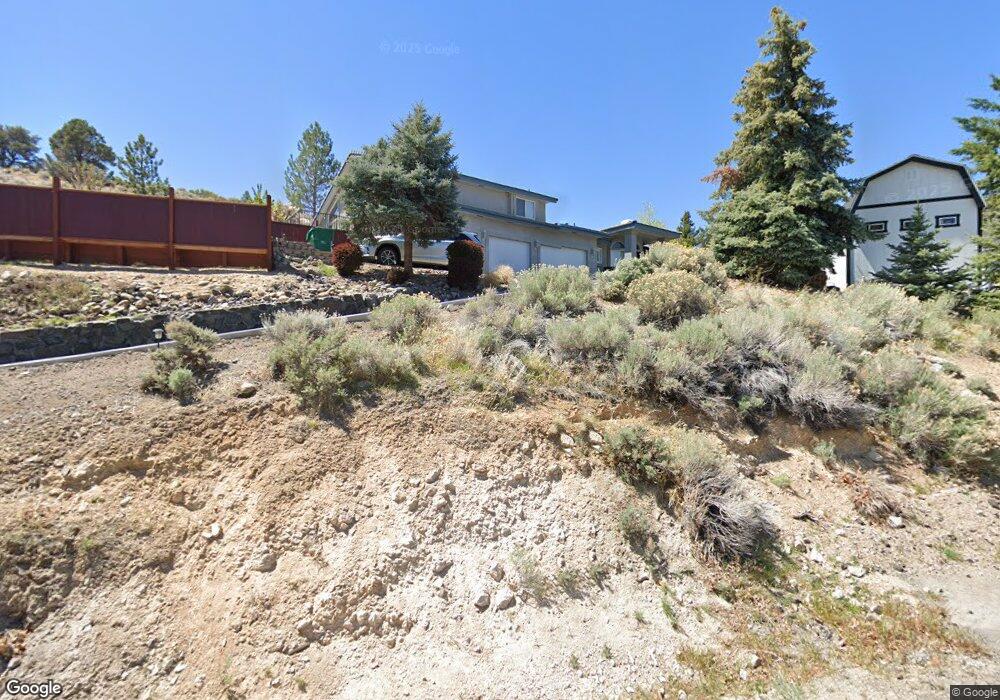
14355 Minnetonka Cir Reno, NV 89521
Virginia Foothills NeighborhoodEstimated Value: $835,000 - $1,102,000
4
Beds
3
Baths
2,872
Sq Ft
$320/Sq Ft
Est. Value
About This Home
This home is located at 14355 Minnetonka Cir, Reno, NV 89521 and is currently estimated at $919,899, approximately $320 per square foot. 14355 Minnetonka Cir is a home located in Washoe County with nearby schools including Brown Elementary School, Marce Herz Middle School, and Galena High School.
Ownership History
Date
Name
Owned For
Owner Type
Purchase Details
Closed on
Dec 15, 2008
Sold by
Wallis James M and Wallis Karen A
Bought by
Wallis James M and Wallis Karen A
Current Estimated Value
Purchase Details
Closed on
Aug 13, 1997
Sold by
Hale Brian K and Hale Diana L
Bought by
Wallis James M and Wallis Karen A
Home Financials for this Owner
Home Financials are based on the most recent Mortgage that was taken out on this home.
Original Mortgage
$160,000
Outstanding Balance
$24,130
Interest Rate
7.61%
Estimated Equity
$895,769
Purchase Details
Closed on
Jun 22, 1995
Sold by
Peck Joseph R and Peck Carol B
Bought by
Hale Brian K and Hale Diana L
Purchase Details
Closed on
Mar 18, 1994
Sold by
Sun Home Builders Inc
Bought by
Peck Joseph R and Peck Carol B
Create a Home Valuation Report for This Property
The Home Valuation Report is an in-depth analysis detailing your home's value as well as a comparison with similar homes in the area
Home Values in the Area
Average Home Value in this Area
Purchase History
| Date | Buyer | Sale Price | Title Company |
|---|---|---|---|
| Wallis James M | -- | None Available | |
| Wallis James M | $235,000 | Western Title Company Inc | |
| Hale Brian K | $207,500 | Western Title Company Inc | |
| Peck Joseph R | $34,000 | Stewart Title |
Source: Public Records
Mortgage History
| Date | Status | Borrower | Loan Amount |
|---|---|---|---|
| Open | Wallis James M | $160,000 |
Source: Public Records
Tax History Compared to Growth
Tax History
| Year | Tax Paid | Tax Assessment Tax Assessment Total Assessment is a certain percentage of the fair market value that is determined by local assessors to be the total taxable value of land and additions on the property. | Land | Improvement |
|---|---|---|---|---|
| 2025 | $3,996 | $156,843 | $42,000 | $114,843 |
| 2024 | $3,996 | $158,205 | $42,000 | $116,205 |
| 2023 | $3,880 | $152,318 | $42,000 | $110,318 |
| 2022 | $3,766 | $129,462 | $37,436 | $92,026 |
| 2021 | $3,656 | $116,913 | $25,228 | $91,685 |
| 2020 | $3,548 | $117,301 | $25,228 | $92,073 |
| 2019 | $3,444 | $111,422 | $21,504 | $89,918 |
| 2018 | $3,346 | $103,067 | $15,008 | $88,059 |
| 2017 | $3,325 | $102,408 | $14,056 | $88,352 |
| 2016 | $3,265 | $103,822 | $12,880 | $90,942 |
| 2015 | $3,254 | $103,609 | $12,488 | $91,121 |
| 2014 | $3,159 | $97,693 | $9,660 | $88,033 |
| 2013 | -- | $94,642 | $8,484 | $86,158 |
Source: Public Records
Map
Nearby Homes
- 14505 Geronimo Trail
- 0 Kenneth Way Unit 230006476
- 14490 Rancheros Dr
- 14690 Rancheros Dr
- 2982 Saddle Peak Dr
- 13820 Virginia Foothills Dr
- 2904 Amethyst Hills Dr
- 3036 Feathertop Dr
- 2944 Ruby Desert Dr
- 645 Paso Fino Ct
- 2964 Ruby Desert Dr
- 597 Connemaras Ct
- 3060 Bristol Dr
- 3026 Copper Stone Dr
- 13545 Cobalt Sky St
- 0 Western Skies Dr Unit 240010170
- 3034 Copper Stone Dr
- 00 Western Skies Dr
- 3028 Amethyst Hills Dr
- 12104 Blacktail Ct
- 14305 Minnetonka Cir
- 14405 Minnetonka Cir
- 14350 Sitting Bull Cir
- 14400 Sitting Bull Cir
- 14400 Sitting Bull Cir Unit 10
- 14360 Minnetonka Cir
- 14300 Sitting Bull Cir
- 14300 Minnetonka Cir
- 14425 Minnetonka Cir
- 14450 Sitting Bull Cir
- 14415 Sitting Bull Cir
- 14425 Sitting Bull Cir Unit 6
- 14240 Minnetonka Cir
- 1455 Sioux Trail
- 14345 Chamy Dr
- 14405 Chamy Dr
- 14355 Sitting Bull Cir
- 14305 Chamy Dr
- 1435 Sioux Trail
- 14425 Chamy Dr