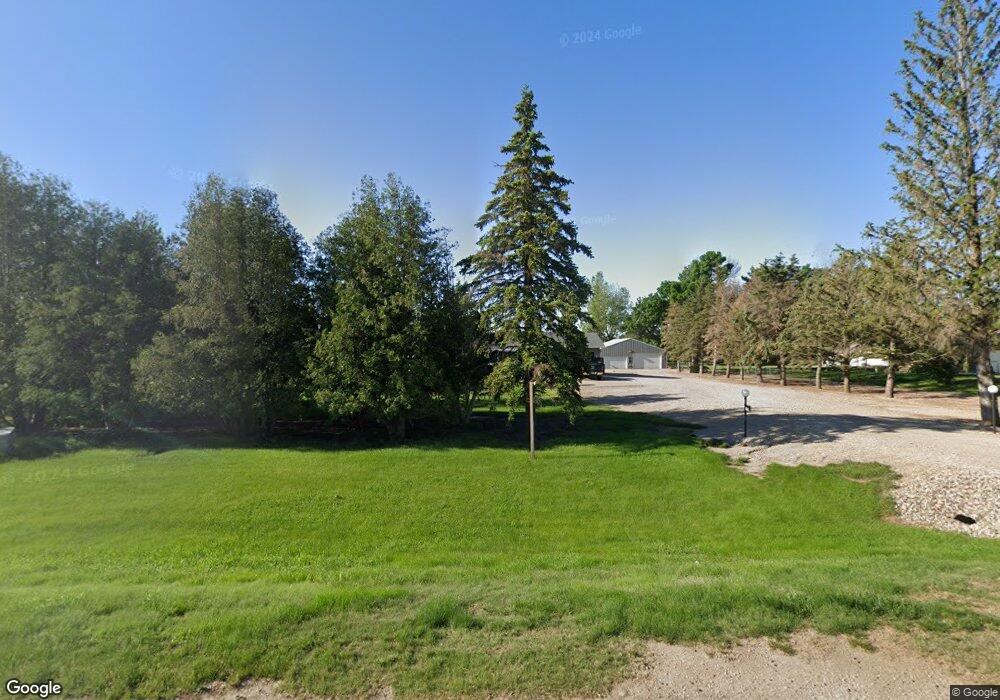
1436 210th St Sergeant Bluff, IA 51054
Estimated Value: $253,000 - $425,000
3
Beds
3
Baths
1,224
Sq Ft
$281/Sq Ft
Est. Value
About This Home
This home is located at 1436 210th St, Sergeant Bluff, IA 51054 and is currently estimated at $343,500, approximately $280 per square foot. 1436 210th St is a home located in Woodbury County with nearby schools including Sergeant Bluff-Luton Primary School, Sergeant Bluff-Luton Elementary School, and Sergeant Bluff-Luton Middle School.
Ownership History
Date
Name
Owned For
Owner Type
Purchase Details
Closed on
Nov 11, 2020
Sold by
Strong Mark A and Strong Michelle M
Bought by
Jensen James D and Jensen Penny J
Current Estimated Value
Home Financials for this Owner
Home Financials are based on the most recent Mortgage that was taken out on this home.
Original Mortgage
$235,000
Outstanding Balance
$209,117
Interest Rate
2.8%
Mortgage Type
New Conventional
Estimated Equity
$134,383
Create a Home Valuation Report for This Property
The Home Valuation Report is an in-depth analysis detailing your home's value as well as a comparison with similar homes in the area
Purchase History
| Date | Buyer | Sale Price | Title Company |
|---|---|---|---|
| Jensen James D | $300,000 | None Available |
Source: Public Records
Mortgage History
| Date | Status | Borrower | Loan Amount |
|---|---|---|---|
| Open | Jensen James D | $235,000 |
Source: Public Records
Tax History
| Year | Tax Paid | Tax Assessment Tax Assessment Total Assessment is a certain percentage of the fair market value that is determined by local assessors to be the total taxable value of land and additions on the property. | Land | Improvement |
|---|---|---|---|---|
| 2025 | $3,347 | $333,100 | $87,600 | $245,500 |
| 2024 | $32 | $323,050 | $58,750 | $264,300 |
| 2023 | $3,048 | $323,050 | $58,750 | $264,300 |
| 2022 | $2,618 | $260,210 | $58,750 | $201,460 |
| 2021 | $2,596 | $226,380 | $58,750 | $167,630 |
| 2020 | $2,752 | $228,390 | $62,860 | $165,530 |
| 2019 | $2,605 | $228,390 | $62,860 | $165,530 |
| 2018 | $2,583 | $215,020 | $49,490 | $165,530 |
| 2017 | $2,930 | $215,020 | $49,490 | $165,530 |
| 2016 | $3,016 | $215,020 | $0 | $0 |
| 2015 | $5,907 | $200,950 | $46,250 | $154,700 |
| 2014 | $5,603 | $200,950 | $46,250 | $154,700 |
Source: Public Records
Map
Nearby Homes
Your Personal Tour Guide
Ask me questions while you tour the home.