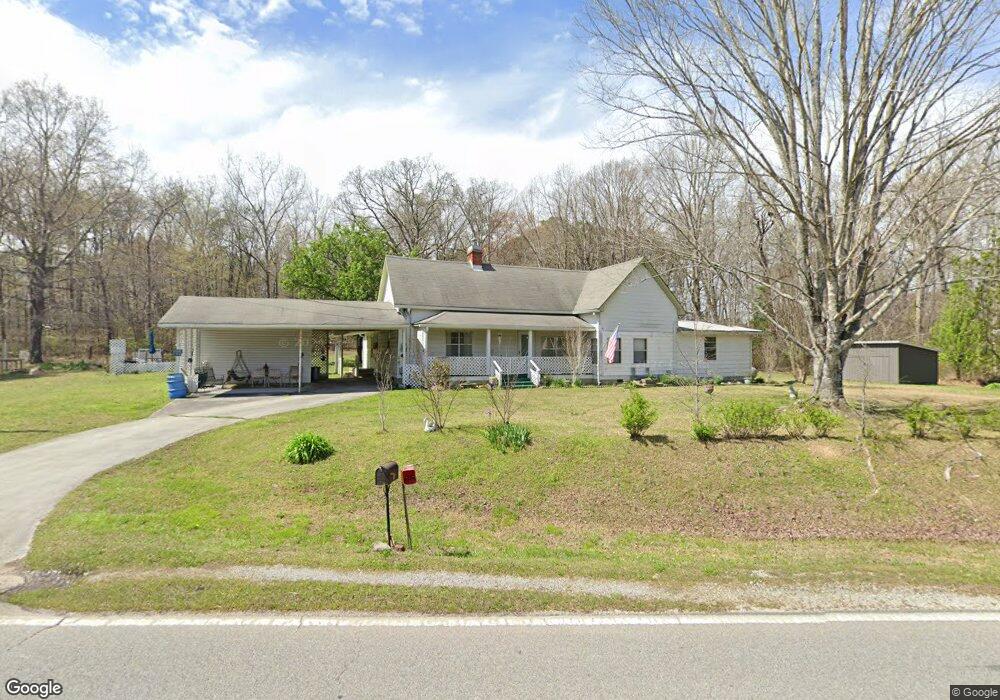
1436 Round Pond Rd La Fayette, GA 30728
Estimated Value: $179,000 - $385,000
--
Bed
2
Baths
2,088
Sq Ft
$141/Sq Ft
Est. Value
About This Home
This home is located at 1436 Round Pond Rd, La Fayette, GA 30728 and is currently estimated at $295,408, approximately $141 per square foot. 1436 Round Pond Rd is a home located in Walker County with nearby schools including Naomi Elementary School, Lafayette Middle School, and Lafayette High School.
Ownership History
Date
Name
Owned For
Owner Type
Purchase Details
Closed on
May 6, 2025
Sold by
Bruce Robin Patterson
Bought by
Martin Justin and Mauk Chad
Current Estimated Value
Home Financials for this Owner
Home Financials are based on the most recent Mortgage that was taken out on this home.
Original Mortgage
$283,116
Outstanding Balance
$190,813
Interest Rate
6.62%
Mortgage Type
New Conventional
Estimated Equity
$104,595
Purchase Details
Closed on
Mar 27, 2019
Sold by
Patterson Frances R
Bought by
Patterson James Randall and Patterson Charles Eugene
Purchase Details
Closed on
May 24, 2013
Sold by
Patterson James R
Bought by
Swafford James A
Purchase Details
Closed on
Dec 8, 1987
Sold by
Millie Young Noblitt
Bought by
Patterson James Robert and Patterson Wf
Purchase Details
Closed on
Jan 1, 1972
Bought by
Millie Young Noblitt
Create a Home Valuation Report for This Property
The Home Valuation Report is an in-depth analysis detailing your home's value as well as a comparison with similar homes in the area
Home Values in the Area
Average Home Value in this Area
Purchase History
| Date | Buyer | Sale Price | Title Company |
|---|---|---|---|
| Martin Justin | $180,000 | -- | |
| Patterson James Randall | -- | -- | |
| Patterson Frances R | -- | -- | |
| Swafford James A | $20,000 | -- | |
| Patterson James Robert | -- | -- | |
| Millie Young Noblitt | -- | -- |
Source: Public Records
Mortgage History
| Date | Status | Borrower | Loan Amount |
|---|---|---|---|
| Open | Martin Justin | $283,116 |
Source: Public Records
Tax History Compared to Growth
Tax History
| Year | Tax Paid | Tax Assessment Tax Assessment Total Assessment is a certain percentage of the fair market value that is determined by local assessors to be the total taxable value of land and additions on the property. | Land | Improvement |
|---|---|---|---|---|
| 2024 | $2,665 | $116,855 | $33,082 | $83,773 |
| 2023 | $2,479 | $105,589 | $26,256 | $79,333 |
| 2022 | $2,097 | $81,264 | $13,149 | $68,115 |
| 2021 | $1,958 | $67,992 | $13,149 | $54,843 |
| 2020 | $1,707 | $56,111 | $13,149 | $42,962 |
| 2019 | $267 | $56,111 | $13,149 | $42,962 |
| 2018 | $1,385 | $52,362 | $10,858 | $41,504 |
| 2017 | $403 | $52,362 | $10,858 | $41,504 |
| 2016 | $147 | $52,362 | $10,858 | $41,504 |
| 2015 | $165 | $40,576 | $19,859 | $20,718 |
| 2014 | $96 | $40,576 | $19,859 | $20,718 |
| 2013 | -- | $50,749 | $30,032 | $20,717 |
Source: Public Records
Map
Nearby Homes
- 450 Arnold Ln
- 1934 Round Pond Rd
- 121 Stock Dog Ln
- 176 Turkey Ridge Rd
- 635 Cook Rd
- 7606 Highway 95
- 901 Dunwoody Rd
- 1039 Dunwoody Rd
- 1585 E Reed Rd
- 0 Clyde Byrd Rd
- 58 Willow Cir
- 1186 E Reed Rd
- 1052 Huffman Rd
- 4384 Round Pond Rd
- 0 Colbert Hollow Rd Unit 1513202
- 533 Van Dell Dr
- 1121 York Rd
- 253 Wesley Rd
- 201 Van Dell Dr
- 1501 Round Pond Rd
- 1500 Round Pond Rd
- 1328 Round Pond Rd
- 1323 Round Pond Rd
- 1350 Round Pond Rd
- 3280 Lake Howard Rd
- 3198 Lake Howard Rd
- 311 Arnold Ln
- 1626 Round Pond Rd
- 223 Arnold Ln
- 1242 Round Pond Rd
- 3382 Lake Howard Rd
- 170 Baxter Dr
- 313 Arnold Ln
- 282 Arnold Ln
- 3170 Lake Howard Rd
- 75 Arnold Ln
- 3116 Lake Howard Rd
- 195 Arnold Ln
- 334 Arnold Ln