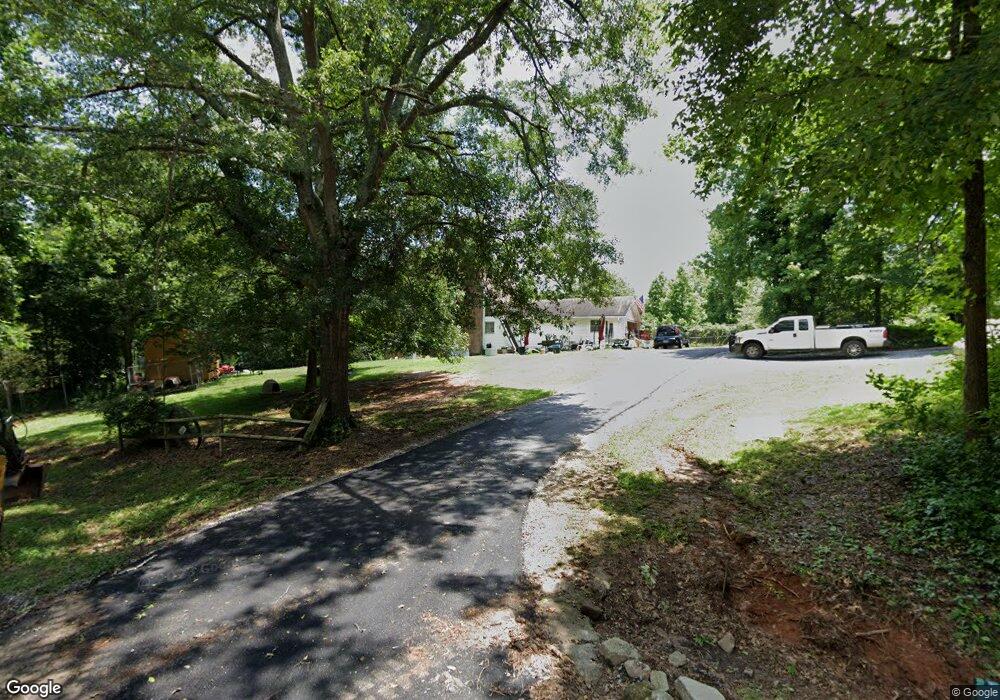
1436 Wages Bridge Rd Nicholson, GA 30565
Estimated Value: $263,000 - $417,000
3
Beds
2
Baths
576
Sq Ft
$601/Sq Ft
Est. Value
About This Home
This home is located at 1436 Wages Bridge Rd, Nicholson, GA 30565 and is currently estimated at $345,983, approximately $600 per square foot. 1436 Wages Bridge Rd is a home located in Jackson County with nearby schools including East Jackson Middle School and East Jackson Comprehensive High School.
Ownership History
Date
Name
Owned For
Owner Type
Purchase Details
Closed on
Apr 10, 2015
Sold by
Wilkes Ted C
Bought by
Guinn Sheila F and Guinn Roy G
Current Estimated Value
Home Financials for this Owner
Home Financials are based on the most recent Mortgage that was taken out on this home.
Original Mortgage
$181,500
Outstanding Balance
$126,624
Interest Rate
3.95%
Mortgage Type
New Conventional
Estimated Equity
$219,359
Purchase Details
Closed on
Jul 26, 2006
Sold by
Not Provided
Bought by
Wilkes Ted C
Home Financials for this Owner
Home Financials are based on the most recent Mortgage that was taken out on this home.
Original Mortgage
$187,192
Interest Rate
6.74%
Mortgage Type
New Conventional
Purchase Details
Closed on
Mar 24, 2004
Sold by
Moore Beth C
Bought by
Burley Thomas Edwin and Lucy Beth Cor
Purchase Details
Closed on
Jan 15, 1999
Sold by
Moore Ruben and Moore Beth
Bought by
Moore Beth C
Create a Home Valuation Report for This Property
The Home Valuation Report is an in-depth analysis detailing your home's value as well as a comparison with similar homes in the area
Home Values in the Area
Average Home Value in this Area
Purchase History
| Date | Buyer | Sale Price | Title Company |
|---|---|---|---|
| Guinn Sheila F | $185,000 | -- | |
| Wilkes Ted C | $169,000 | -- | |
| Burley Thomas Edwin | -- | -- | |
| Moore Beth C | -- | -- |
Source: Public Records
Mortgage History
| Date | Status | Borrower | Loan Amount |
|---|---|---|---|
| Open | Guinn Sheila F | $181,500 | |
| Previous Owner | Wilkes Ted C | $187,192 |
Source: Public Records
Tax History Compared to Growth
Tax History
| Year | Tax Paid | Tax Assessment Tax Assessment Total Assessment is a certain percentage of the fair market value that is determined by local assessors to be the total taxable value of land and additions on the property. | Land | Improvement |
|---|---|---|---|---|
| 2024 | $2,722 | $108,260 | $27,480 | $80,780 |
| 2023 | $2,722 | $88,176 | $27,480 | $60,696 |
| 2022 | $1,602 | $56,896 | $9,320 | $47,576 |
| 2021 | $1,580 | $56,704 | $9,320 | $47,384 |
| 2020 | $1,463 | $48,224 | $9,320 | $38,904 |
| 2019 | $1,544 | $48,224 | $9,320 | $38,904 |
| 2018 | $1,519 | $46,776 | $9,320 | $37,456 |
| 2017 | $1,267 | $38,688 | $8,226 | $30,462 |
| 2016 | $1,274 | $38,688 | $8,226 | $30,462 |
| 2015 | $1,280 | $38,689 | $8,226 | $30,462 |
| 2014 | $1,791 | $54,609 | $8,226 | $46,382 |
| 2013 | -- | $54,608 | $8,226 | $46,382 |
Source: Public Records
Map
Nearby Homes
- 0 Nowhere Ln Unit 10544151
- 425 Bob Holman Rd
- 1718 Ed Bennett Rd
- 130 Levi Trail
- 140 Levi Trail
- 170 Rocky Dr
- 2850 Commerce Rd
- 97 Abby Ln
- 145 Noketchee Dr
- 185 Hemlock Way
- 4419 New Kings Bridge Rd
- 0 US Hwy 441 S Unit 20890220
- 310 Sawdust Rd
- 221 Frederick Dr
- 10 Red Rose Rd
- 322 Cedar Tree Ln
- 424 Belhaven Ln
- 0 Old Commerce Rd Unit 10617666
- 256 Frederick Dr
- 1370 Wages Bridge Rd
- 1305 Wages Bridge Rd
- 1212 Wages Bridge Rd
- 1253 Wages Bridge Rd
- 1217 Wages Bridge Rd
- 1145 Wages Bridge Rd
- 473 Kesler Rd
- 1029 Wages Bridge Rd
- 270 Waterford Place
- 361 Waterford Place
- 268 Kesler Rd
- Lot 12 Waterford Place
- Lot 14 Waterford Place
- - Waterford Place Unit Lot 19
- #11 Waterford Place
- Lot 21 Waterford Place
- Lot 6 Waterford Place
- - Waterford Place Unit Lot 17
- Lot 29 Waterford Place
- Lot 8 Waterford Place