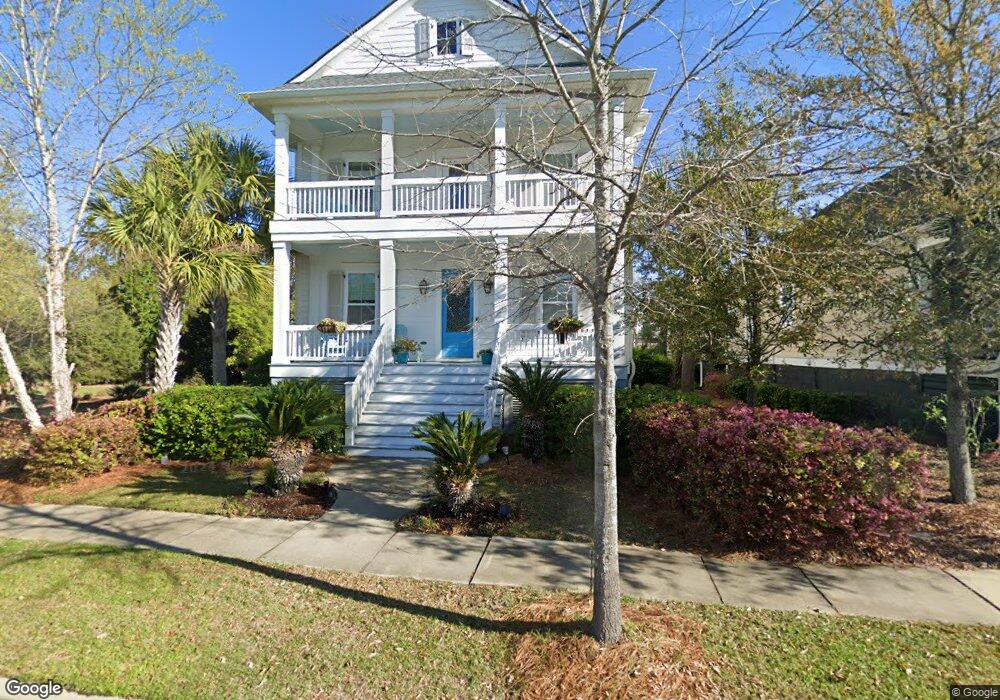
1436 Wando Landing St Daniel Island, SC 29492
Daniel Island NeighborhoodEstimated Value: $1,457,259 - $1,692,000
3
Beds
3
Baths
2,800
Sq Ft
$566/Sq Ft
Est. Value
About This Home
This home is located at 1436 Wando Landing St, Daniel Island, SC 29492 and is currently estimated at $1,583,815, approximately $565 per square foot. 1436 Wando Landing St is a home with nearby schools including Daniel Island School and Bishop England High School.
Ownership History
Date
Name
Owned For
Owner Type
Purchase Details
Closed on
Feb 24, 2015
Sold by
Hayre Wilhelmina M
Bought by
Tran Long V and Tran Oahn K
Current Estimated Value
Home Financials for this Owner
Home Financials are based on the most recent Mortgage that was taken out on this home.
Original Mortgage
$417,000
Outstanding Balance
$320,203
Interest Rate
3.75%
Mortgage Type
New Conventional
Estimated Equity
$1,263,612
Purchase Details
Closed on
Dec 21, 2011
Sold by
Weekley Homes Lp
Bought by
Hayre James Kenneth and Hayre Wilhelmina M
Purchase Details
Closed on
Dec 14, 2011
Sold by
Daniel Island Associates Llc
Bought by
Weekley Homes Lp
Purchase Details
Closed on
Sep 9, 2011
Sold by
Daniel Island Associates Llc
Bought by
Weekley Homes Lp
Home Financials for this Owner
Home Financials are based on the most recent Mortgage that was taken out on this home.
Original Mortgage
$80,000,000
Interest Rate
4.55%
Mortgage Type
Purchase Money Mortgage
Create a Home Valuation Report for This Property
The Home Valuation Report is an in-depth analysis detailing your home's value as well as a comparison with similar homes in the area
Home Values in the Area
Average Home Value in this Area
Purchase History
| Date | Buyer | Sale Price | Title Company |
|---|---|---|---|
| Tran Long V | $600,000 | -- | |
| Hayre James Kenneth | $526,121 | -- | |
| Weekley Homes Lp | $15,224 | -- | |
| Weekley Homes Lp | $90,000 | -- |
Source: Public Records
Mortgage History
| Date | Status | Borrower | Loan Amount |
|---|---|---|---|
| Open | Tran Long V | $417,000 | |
| Previous Owner | Weekley Homes Lp | $80,000,000 |
Source: Public Records
Tax History Compared to Growth
Tax History
| Year | Tax Paid | Tax Assessment Tax Assessment Total Assessment is a certain percentage of the fair market value that is determined by local assessors to be the total taxable value of land and additions on the property. | Land | Improvement |
|---|---|---|---|---|
| 2025 | $4,564 | $748,535 | $227,797 | $520,738 |
| 2024 | $4,559 | $29,942 | $9,112 | $20,830 |
| 2023 | $4,559 | $29,942 | $9,112 | $20,830 |
| 2022 | $4,137 | $26,036 | $5,600 | $20,436 |
| 2021 | $4,212 | $26,040 | $5,600 | $20,436 |
| 2020 | $4,298 | $26,036 | $5,600 | $20,436 |
| 2019 | $4,915 | $27,040 | $5,600 | $21,440 |
| 2018 | $4,427 | $24,296 | $5,200 | $19,096 |
| 2017 | $4,420 | $24,296 | $5,200 | $19,096 |
| 2016 | $13,032 | $36,440 | $7,800 | $28,640 |
| 2015 | $3,510 | $37,780 | $7,800 | $29,980 |
| 2014 | $3,506 | $20,300 | $4,400 | $15,900 |
| 2013 | -- | $20,300 | $4,400 | $15,900 |
Source: Public Records
Map
Nearby Homes
- 1459 Wando Landing St
- 2548 Josiah St
- 925 Fish Camp Rd
- 938 Fish Camp Rd
- 821 Roddin St
- 1659 Pierce St
- 1119 Oak Overhang St
- 1710 Trewin Ct
- 1431 Wando View St
- 1722 Trewin Ct
- 1389 Smythe St
- 1225 Blakeway St Unit 504
- 1225 Blakeway St Unit 906
- 1225 Blakeway St Unit 703
- 1415 Smythe St
- 1709 Doldridge St
- 1237 Water View Ln
- 1826 Pierce St
- 1844 Pierce St
- 2038 Pierce St
- 1436 Wando Landing St
- 1440 Wando Landing St
- 1444 Wando Landing St
- 1444 Wando Landing St
- 2401 Louisville St
- 1448 Wando Landing St
- 1295 Smythe St
- 1299 Smythe St
- 2482 Daniel Island Dr
- 1445 Wando Landing St
- 1454 Wando Landing St
- 1454 Wando Landing St
- 1445 Wando Landing St
- 1303 Smythe St
- 2409 Louisville St
- 2486 Daniel Island Dr
- 1451 Wando Landing St
- 1307 Smythe St
- 1458 Wando Landing St
- 1458 Wando Landing St