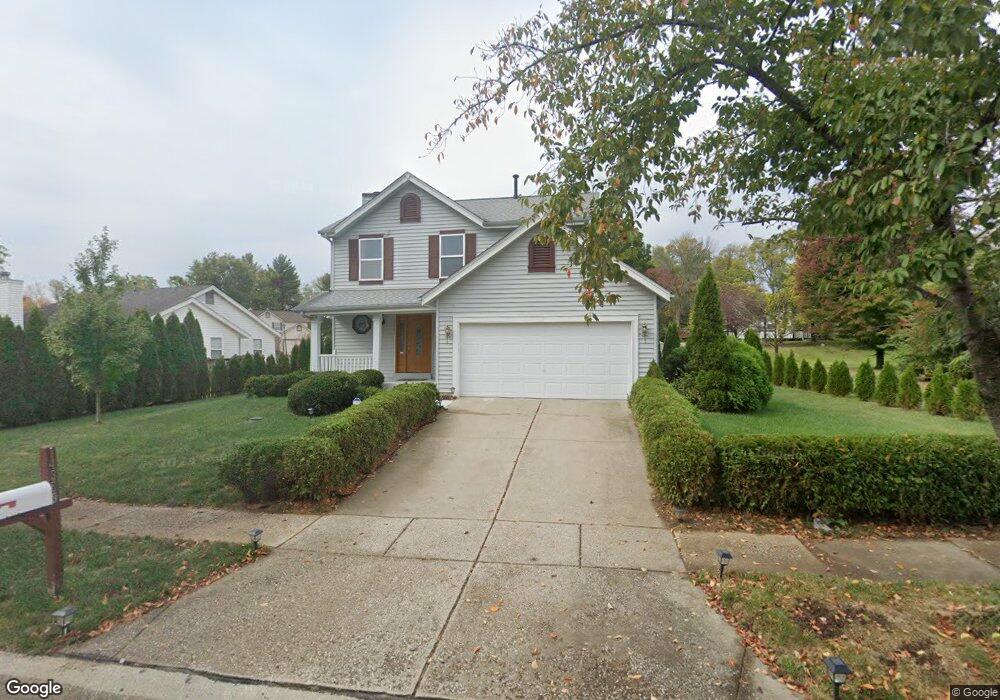
14369 Jamestown Bay Dr Florissant, MO 63034
Estimated Value: $218,000 - $247,000
3
Beds
3
Baths
1,637
Sq Ft
$141/Sq Ft
Est. Value
About This Home
This home is located at 14369 Jamestown Bay Dr, Florissant, MO 63034 and is currently estimated at $231,392, approximately $141 per square foot. 14369 Jamestown Bay Dr is a home located in St. Louis County with nearby schools including Barrington Elementary School, Central Middle School, and Hazelwood Central High School.
Ownership History
Date
Name
Owned For
Owner Type
Purchase Details
Closed on
Jul 24, 2002
Sold by
Doering Mtg Corp
Bought by
Hunt Richard
Current Estimated Value
Home Financials for this Owner
Home Financials are based on the most recent Mortgage that was taken out on this home.
Original Mortgage
$130,950
Outstanding Balance
$54,803
Interest Rate
6.53%
Estimated Equity
$176,589
Purchase Details
Closed on
Sep 1, 2000
Sold by
Doering Mtg Corp
Bought by
Easley Jasper Carl
Home Financials for this Owner
Home Financials are based on the most recent Mortgage that was taken out on this home.
Original Mortgage
$124,500
Interest Rate
8.15%
Mortgage Type
Seller Take Back
Purchase Details
Closed on
Apr 27, 2000
Sold by
Johnson Alice M
Bought by
Doering Mtg Corp
Purchase Details
Closed on
Jul 31, 1997
Sold by
Bennett Ricky A
Bought by
Johnson Alica M
Home Financials for this Owner
Home Financials are based on the most recent Mortgage that was taken out on this home.
Original Mortgage
$82,425
Interest Rate
12.4%
Create a Home Valuation Report for This Property
The Home Valuation Report is an in-depth analysis detailing your home's value as well as a comparison with similar homes in the area
Home Values in the Area
Average Home Value in this Area
Purchase History
| Date | Buyer | Sale Price | Title Company |
|---|---|---|---|
| Hunt Richard | $135,000 | -- | |
| Easley Jasper Carl | $129,900 | Capital Title | |
| Doering Mtg Corp | $97,500 | -- | |
| Johnson Alica M | -- | -- |
Source: Public Records
Mortgage History
| Date | Status | Borrower | Loan Amount |
|---|---|---|---|
| Open | Hunt Richard | $130,950 | |
| Previous Owner | Easley Jasper Carl | $124,500 | |
| Previous Owner | Johnson Alica M | $82,425 | |
| Closed | Johnson Alica M | $16,485 |
Source: Public Records
Tax History Compared to Growth
Tax History
| Year | Tax Paid | Tax Assessment Tax Assessment Total Assessment is a certain percentage of the fair market value that is determined by local assessors to be the total taxable value of land and additions on the property. | Land | Improvement |
|---|---|---|---|---|
| 2025 | $3,030 | $44,440 | $7,370 | $37,070 |
| 2024 | $3,030 | $33,540 | $2,950 | $30,590 |
| 2023 | $3,020 | $33,540 | $2,950 | $30,590 |
| 2022 | $2,797 | $27,630 | $6,460 | $21,170 |
| 2021 | $2,646 | $27,630 | $6,460 | $21,170 |
| 2020 | $2,684 | $26,110 | $4,810 | $21,300 |
| 2019 | $2,663 | $26,110 | $4,810 | $21,300 |
| 2018 | $2,522 | $22,860 | $3,690 | $19,170 |
| 2017 | $2,520 | $22,860 | $3,690 | $19,170 |
| 2016 | $2,696 | $24,080 | $3,330 | $20,750 |
| 2015 | $2,594 | $24,080 | $3,330 | $20,750 |
| 2014 | $2,486 | $22,970 | $2,600 | $20,370 |
Source: Public Records
Map
Nearby Homes
- 14471 Williamsburg Manor Dr
- 14434 Cape Charles Ct
- 5473 Misty Crossing Ct
- 5625 Delcastle Dr
- 5220 Delcastle Dr
- 4365 Old Jamestown Winery Rd
- 5618 Madlar Ln
- 210 Behlmann Meadows Way
- 173 Behlmann Meadows Way
- 107 Behlmann Orchard Ct
- 4629 Richmond Forest Dr
- 14333 River Oaks Ct
- 4304 Inlet Isle Dr Unit 7
- 4328 Inlet Isle Dr
- 123 Hollow Brook Dr
- 13630 Old Halls Ferry Rd
- 14214 Ashbury Meadows Dr
- 6360 Silver Fox Dr
- 3898 Hirondelle Ln
- 13124 Crestwood Bend Ln
- 14375 Jamestown Bay Dr
- 5211 Jamestown Bay Ct
- 5207 Jamestown Bay Ct
- 14381 Jamestown Bay Dr
- 14368 Jamestown Bay Dr
- 5204 Bay Point Dr
- 14372 Jamestown Bay Dr
- 14364 Jamestown Bay Dr
- 14376 Jamestown Bay Dr
- 5203 Jamestown Bay Ct
- 5210 Jamestown Bay Ct
- 14360 Jamestown Bay Dr
- 14380 Jamestown Bay Dr
- 5201 Bay Point Dr
- 14356 Jamestown Bay Dr
- 14384 Jamestown Bay Dr
- 14475 Williamsburg Manor Dr
- 14475 Williamsburg
- 5206 Jamestown Bay Ct
- 5185 N Highway 67