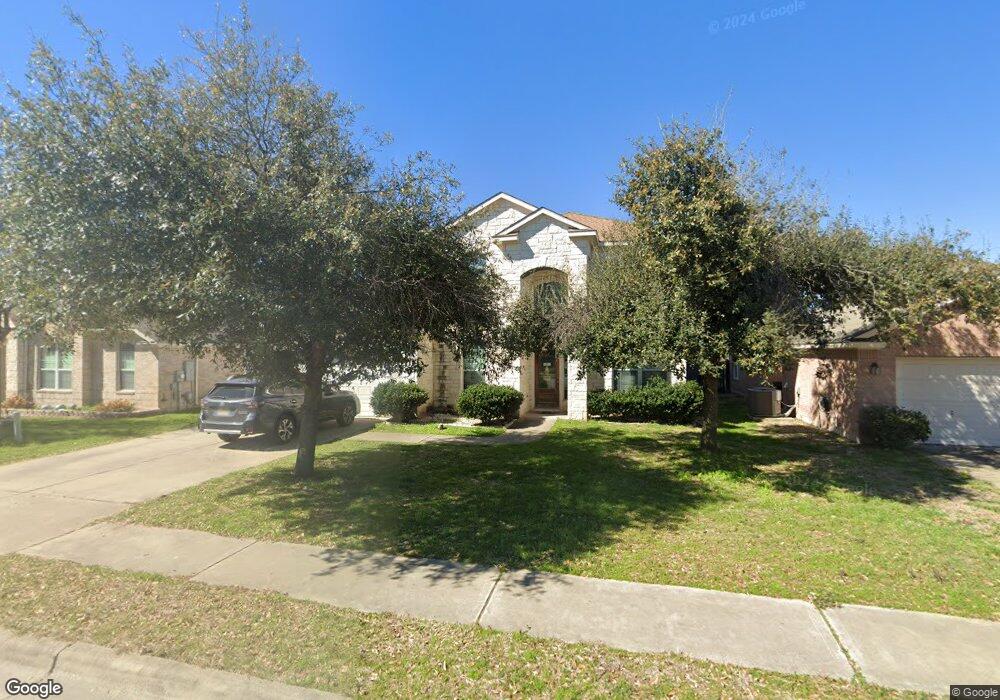
1437 Clary Sage Loop Round Rock, TX 78665
Gattis School NeighborhoodEstimated Value: $413,000 - $523,000
--
Bed
3
Baths
3,222
Sq Ft
$143/Sq Ft
Est. Value
About This Home
This home is located at 1437 Clary Sage Loop, Round Rock, TX 78665 and is currently estimated at $460,818, approximately $143 per square foot. 1437 Clary Sage Loop is a home located in Williamson County with nearby schools including Gattis Elementary School, Ridgeview Middle School, and Cedar Ridge High School.
Ownership History
Date
Name
Owned For
Owner Type
Purchase Details
Closed on
Jan 29, 2024
Sold by
Lati Bouraima
Bought by
Bouraima Latrice
Current Estimated Value
Home Financials for this Owner
Home Financials are based on the most recent Mortgage that was taken out on this home.
Original Mortgage
$54,985
Outstanding Balance
$48,503
Interest Rate
6.61%
Mortgage Type
New Conventional
Estimated Equity
$412,315
Purchase Details
Closed on
Sep 11, 2019
Sold by
Bouraima Lati
Bought by
Bouraima Lati K and Bouraima Latrice A
Purchase Details
Closed on
Sep 28, 2006
Sold by
Kimball Hill Homes Austin Lp
Bought by
Bouraima Lati
Home Financials for this Owner
Home Financials are based on the most recent Mortgage that was taken out on this home.
Original Mortgage
$198,973
Interest Rate
6.51%
Mortgage Type
FHA
Create a Home Valuation Report for This Property
The Home Valuation Report is an in-depth analysis detailing your home's value as well as a comparison with similar homes in the area
Home Values in the Area
Average Home Value in this Area
Purchase History
| Date | Buyer | Sale Price | Title Company |
|---|---|---|---|
| Bouraima Latrice | -- | None Listed On Document | |
| Bouraima Lati K | -- | None Available | |
| Bouraima Lati | -- | Prosperity Title |
Source: Public Records
Mortgage History
| Date | Status | Borrower | Loan Amount |
|---|---|---|---|
| Open | Bouraima Latrice | $54,985 | |
| Previous Owner | Bouraima Lati | $198,973 |
Source: Public Records
Tax History Compared to Growth
Tax History
| Year | Tax Paid | Tax Assessment Tax Assessment Total Assessment is a certain percentage of the fair market value that is determined by local assessors to be the total taxable value of land and additions on the property. | Land | Improvement |
|---|---|---|---|---|
| 2025 | $3,800 | $475,081 | -- | -- |
| 2024 | $3,800 | $431,892 | -- | -- |
| 2023 | $3,431 | $392,629 | $0 | $0 |
| 2022 | $6,769 | $356,935 | $0 | $0 |
| 2021 | $7,284 | $324,486 | $60,300 | $297,767 |
| 2020 | $6,659 | $294,987 | $57,369 | $237,618 |
| 2019 | $7,234 | $313,331 | $52,781 | $260,550 |
| 2018 | $5,269 | $302,372 | $48,054 | $254,318 |
| 2017 | $7,088 | $300,883 | $44,910 | $255,973 |
| 2016 | $6,762 | $287,024 | $44,910 | $242,114 |
| 2015 | $5,454 | $264,655 | $37,170 | $227,629 |
| 2014 | $5,454 | $240,595 | $0 | $0 |
Source: Public Records
Map
Nearby Homes
- Elkhound Plan at Double Creek Crossing - City Home Series
- Capshaw Plan at Double Creek Crossing - Classic Series
- Alderwood Plan at Double Creek Crossing - Craftsman Series
- Heeler Plan at Double Creek Crossing - City Home Series
- Keagan Plan at Double Creek Crossing - Craftsman Series
- Spinnaker Plan at Double Creek Crossing - Classic Series
- Markham Plan at Double Creek Crossing - Craftsman Series
- Lackland Plan at Double Creek Crossing - City Home Series
- Foxtail Plan at Double Creek Crossing - Classic Series
- Fawn Plan at Double Creek Crossing - City Home Series
- Rothbury Plan at Double Creek Crossing - Classic Series
- Huxley Plan at Double Creek Crossing - Craftsman Series
- Audrey Plan at Double Creek Crossing - Classic Series
- Baines Plan at Double Creek Crossing - Craftsman Series
- 817 Nadal Path
- 835 Perry Pass
- 829 Nadal Path
- 825 Venus Cir
- 825 Nadal Path
- 838 Nadal Path
- 1433 Clary Sage Loop
- 1441 Clary Sage Loop
- 1429 Clary Sage Loop
- 1445 Clary Sage Loop
- 1436 Clary Sage Loop
- 1440 Clary Sage Loop
- 1425 Clary Sage Loop
- 1449 Clary Sage Loop
- 1432 Clary Sage Loop
- 1444 Clary Sage Loop
- 1428 Clary Sage Loop
- 1453 Clary Sage Loop
- 1448 Clary Sage Loop
- 1421 Clary Sage Loop
- 1424 Clary Sage Loop
- 1334 Irish Moss Trail
- 1452 Clary Sage Loop
- 1334 Irishmoss Trail
- 1330 Irishmoss Trail
- 1338 Irishmoss Trail