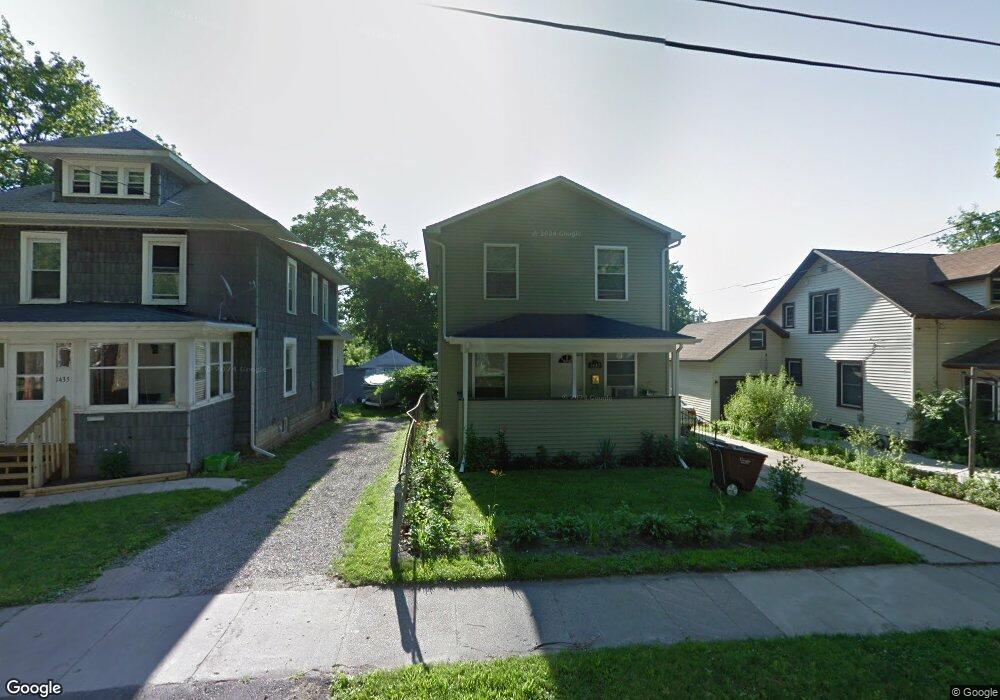
1437 Lyons Ave Lansing, MI 48910
Fabulous Acres NeighborhoodEstimated Value: $83,000 - $129,108
Studio
--
Bath
1,584
Sq Ft
$70/Sq Ft
Est. Value
About This Home
This home is located at 1437 Lyons Ave, Lansing, MI 48910 and is currently estimated at $110,777, approximately $69 per square foot. 1437 Lyons Ave is a home located in Ingham County with nearby schools including Lyons Elementary School, Pattengill Academy, and Eastern High School.
Ownership History
Date
Name
Owned For
Owner Type
Purchase Details
Closed on
Apr 22, 2004
Sold by
Greater Lansing Housing Coalition Non Pr
Bought by
Vang Bai
Current Estimated Value
Home Financials for this Owner
Home Financials are based on the most recent Mortgage that was taken out on this home.
Original Mortgage
$70,887
Outstanding Balance
$32,892
Interest Rate
5.46%
Mortgage Type
FHA
Estimated Equity
$77,885
Purchase Details
Closed on
Sep 18, 2003
Sold by
Costigan Ron and Costigan Carolyn
Bought by
Greater Lansing Housing Coalition
Purchase Details
Closed on
Mar 11, 1999
Sold by
Esi 97A
Bought by
Costigan Ron and Costigan Carolyn
Purchase Details
Closed on
Oct 1, 1993
Create a Home Valuation Report for This Property
The Home Valuation Report is an in-depth analysis detailing your home's value as well as a comparison with similar homes in the area
Home Values in the Area
Average Home Value in this Area
Purchase History
| Date | Buyer | Sale Price | Title Company |
|---|---|---|---|
| Vang Bai | $72,000 | Midstate | |
| Greater Lansing Housing Coalition | $12,500 | Midstate Title Co | |
| Costigan Ron | -- | -- | |
| -- | $14,000 | -- |
Source: Public Records
Mortgage History
| Date | Status | Borrower | Loan Amount |
|---|---|---|---|
| Open | Vang Bai | $70,887 | |
| Closed | Vang Bai | $1,000 |
Source: Public Records
Tax History
| Year | Tax Paid | Tax Assessment Tax Assessment Total Assessment is a certain percentage of the fair market value that is determined by local assessors to be the total taxable value of land and additions on the property. | Land | Improvement |
|---|---|---|---|---|
| 2025 | $2,660 | $64,800 | $4,600 | $60,200 |
| 2024 | $21 | $53,400 | $4,600 | $48,800 |
| 2023 | $2,494 | $47,300 | $4,600 | $42,700 |
| 2022 | $2,250 | $42,800 | $3,500 | $39,300 |
| 2021 | $2,203 | $42,500 | $3,300 | $39,200 |
| 2020 | $2,190 | $40,000 | $3,300 | $36,700 |
| 2019 | $2,098 | $36,900 | $3,300 | $33,600 |
| 2018 | $1,967 | $33,300 | $3,300 | $30,000 |
| 2017 | $1,883 | $33,300 | $3,300 | $30,000 |
| 2016 | $1,882 | $32,700 | $3,300 | $29,400 |
| 2015 | $1,882 | $32,200 | $6,513 | $25,687 |
| 2014 | $1,882 | $33,200 | $4,429 | $28,771 |
Source: Public Records
Map
Nearby Homes
- 1437 Ada St
- 1515 Linval St
- 1423 Pontiac St
- 1601 Bailey St
- 1535 Linval St
- 506 Christiancy St
- 616 Isbell St
- 1731 Lyons Ave
- 534 Isbell St
- 1501 Shubel Ave
- 1731 Herbert St
- 704 Mckim Ave
- 147 Isbell St
- 315 E Mount Hope Ave
- 1134 S Holmes St
- 2118 Roberts Ln
- 218 E Elm St
- 1001 Raider St
- 1807 Teel Ave
- 2201 S Pennsylvania Ave
Your Personal Tour Guide
Ask me questions while you tour the home.