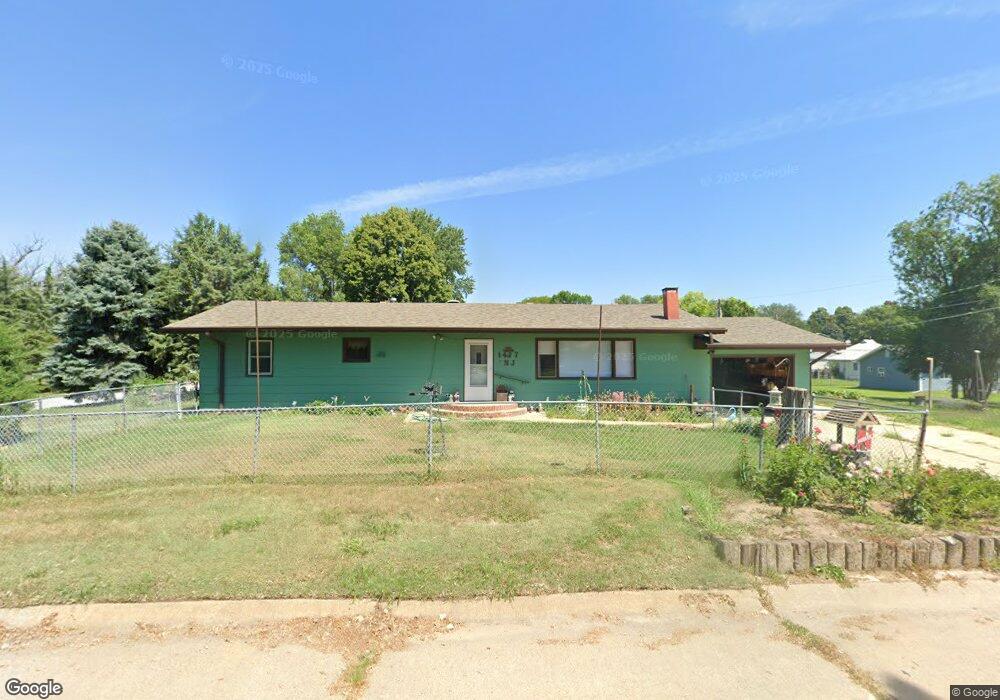
1437 N J St Broken Bow, NE 68822
Estimated Value: $96,000 - $168,000
--
Bed
--
Bath
1,296
Sq Ft
$105/Sq Ft
Est. Value
About This Home
This home is located at 1437 N J St, Broken Bow, NE 68822 and is currently estimated at $136,036, approximately $104 per square foot. 1437 N J St is a home with nearby schools including North Park Elementary School, Broken Bow Junior High School, and Broken Bow High School.
Ownership History
Date
Name
Owned For
Owner Type
Purchase Details
Closed on
Jun 24, 2024
Sold by
Ekdahl Kenda and Ekdahl Michal
Bought by
Clay Kimberly and Klinkman Robert
Current Estimated Value
Home Financials for this Owner
Home Financials are based on the most recent Mortgage that was taken out on this home.
Original Mortgage
$92,150
Outstanding Balance
$90,802
Interest Rate
6.99%
Mortgage Type
New Conventional
Estimated Equity
$45,234
Create a Home Valuation Report for This Property
The Home Valuation Report is an in-depth analysis detailing your home's value as well as a comparison with similar homes in the area
Home Values in the Area
Average Home Value in this Area
Purchase History
| Date | Buyer | Sale Price | Title Company |
|---|---|---|---|
| Clay Kimberly | $97,000 | Custer Title & Abs |
Source: Public Records
Mortgage History
| Date | Status | Borrower | Loan Amount |
|---|---|---|---|
| Open | Clay Kimberly | $92,150 |
Source: Public Records
Tax History Compared to Growth
Tax History
| Year | Tax Paid | Tax Assessment Tax Assessment Total Assessment is a certain percentage of the fair market value that is determined by local assessors to be the total taxable value of land and additions on the property. | Land | Improvement |
|---|---|---|---|---|
| 2025 | $1,021 | $79,942 | $18,739 | $61,203 |
| 2024 | $1,021 | $74,870 | $18,739 | $56,131 |
| 2023 | $0 | $69,676 | $18,739 | $50,937 |
| 2022 | $141 | $52,029 | $18,739 | $33,290 |
| 2021 | $141 | $50,858 | $17,568 | $33,290 |
| 2020 | $141 | $50,858 | $17,568 | $33,290 |
| 2019 | $141 | $51,805 | $8,784 | $43,021 |
| 2017 | $523 | $49,327 | $8,784 | $40,543 |
| 2016 | $534 | $45,931 | $5,388 | $40,543 |
| 2015 | $245 | $43,867 | $5,280 | $38,587 |
| 2014 | $245 | $39,879 | $4,800 | $35,079 |
Source: Public Records
Map
Nearby Homes