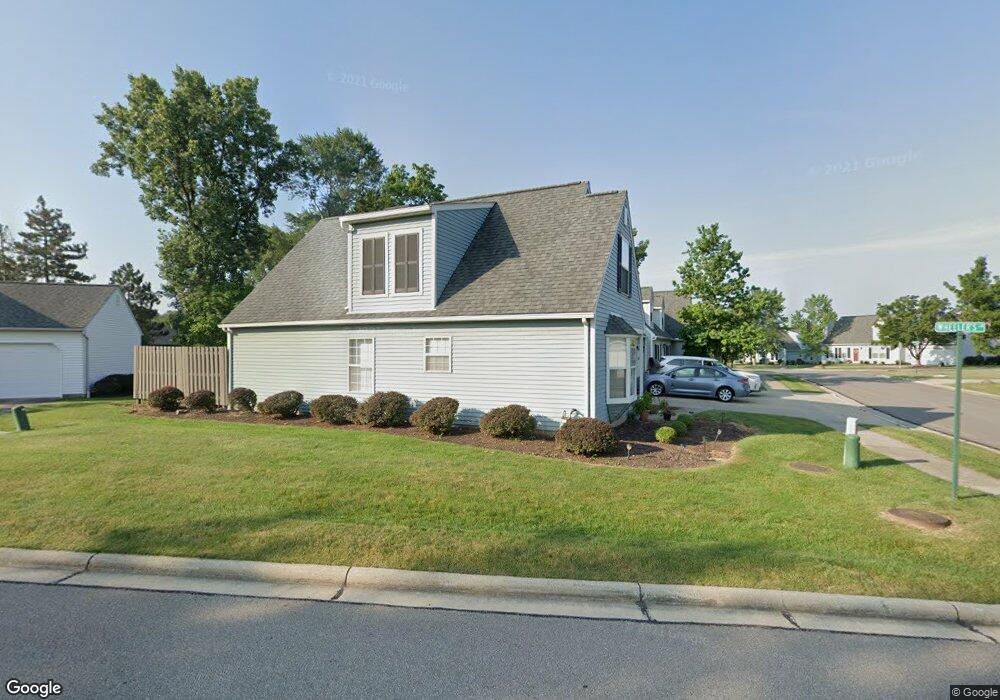
14375 Thatchers Ln Unit X72 Strongsville, OH 44149
Estimated Value: $234,995 - $255,000
2
Beds
2
Baths
1,200
Sq Ft
$207/Sq Ft
Est. Value
About This Home
This home is located at 14375 Thatchers Ln Unit X72, Strongsville, OH 44149 and is currently estimated at $248,749, approximately $207 per square foot. 14375 Thatchers Ln Unit X72 is a home located in Cuyahoga County with nearby schools including Strongsville High School, Strongsville Academy, and Sts Joseph & John Interparochial School.
Ownership History
Date
Name
Owned For
Owner Type
Purchase Details
Closed on
Nov 28, 2007
Sold by
Brickley James A and Brickley Ruth A
Bought by
Brooks Rosemary A
Current Estimated Value
Home Financials for this Owner
Home Financials are based on the most recent Mortgage that was taken out on this home.
Original Mortgage
$72,000
Outstanding Balance
$45,972
Interest Rate
6.47%
Mortgage Type
Purchase Money Mortgage
Estimated Equity
$202,777
Purchase Details
Closed on
Apr 12, 2005
Sold by
Borisenko Gregori and Borisenko Nina
Bought by
Brickley James A and Brickley Ruth A
Home Financials for this Owner
Home Financials are based on the most recent Mortgage that was taken out on this home.
Original Mortgage
$114,750
Interest Rate
5.88%
Mortgage Type
Purchase Money Mortgage
Purchase Details
Closed on
Apr 4, 2002
Sold by
Fish Eleanor M
Bought by
Borisenko Gregori and Borisenko Nina
Purchase Details
Closed on
Jan 1, 1993
Bought by
Fish Eleanor M
Create a Home Valuation Report for This Property
The Home Valuation Report is an in-depth analysis detailing your home's value as well as a comparison with similar homes in the area
Home Values in the Area
Average Home Value in this Area
Purchase History
| Date | Buyer | Sale Price | Title Company |
|---|---|---|---|
| Brooks Rosemary A | $147,000 | Barrister Title Agency | |
| Brickley James A | $153,000 | Midland Title Agency | |
| Borisenko Gregori | $135,000 | -- | |
| Fish Eleanor M | -- | -- |
Source: Public Records
Mortgage History
| Date | Status | Borrower | Loan Amount |
|---|---|---|---|
| Open | Brooks Rosemary A | $72,000 | |
| Previous Owner | Brickley James A | $114,750 |
Source: Public Records
Tax History Compared to Growth
Tax History
| Year | Tax Paid | Tax Assessment Tax Assessment Total Assessment is a certain percentage of the fair market value that is determined by local assessors to be the total taxable value of land and additions on the property. | Land | Improvement |
|---|---|---|---|---|
| 2024 | $3,310 | $70,490 | $7,315 | $63,175 |
| 2023 | $3,275 | $52,300 | $5,220 | $47,080 |
| 2022 | $3,251 | $52,290 | $5,215 | $47,075 |
| 2021 | $3,225 | $52,290 | $5,220 | $47,080 |
| 2020 | $2,763 | $39,620 | $3,960 | $35,670 |
| 2019 | $2,682 | $113,200 | $11,300 | $101,900 |
| 2018 | $2,434 | $39,620 | $3,960 | $35,670 |
| 2017 | $2,566 | $38,680 | $3,680 | $35,000 |
| 2016 | $2,545 | $38,680 | $3,680 | $35,000 |
| 2015 | $2,775 | $38,680 | $3,680 | $35,000 |
| 2014 | $2,775 | $41,590 | $3,960 | $37,630 |
Source: Public Records
Map
Nearby Homes
- 19620 Porters Ln Unit 15F
- 14112 Settlers Way
- 19160 Wheelers Ln
- 19513 Lunn Rd
- 20078 Trapper Trail
- 18630 Shurmer Rd
- 13156 Olympus Way
- 13099 Olympus Way
- 13066 Olympus Way
- 13236 Tomson Dr
- 15017 Regency Dr
- 15279 Walnut Creek Dr
- 12539 Olympus Way
- 12694 Ionia Ct
- 12647 Edgepark Cir
- 18162 Fawn Cir
- 12385 Corinth Ct
- 14896 Britannia Ct
- 19311 Bradford Ct
- 20678 Spruce Dr
- 14391 Thatchers Ln Unit Y74
- 14367 Thatchers Ln Unit X71
- 14351 Thatchers Ln
- 14387 Thatchers Ln
- 14415 Thatchers Ln Unit Y75
- 14335 Thatchers Ln Unit X69
- 14339 Thatchers Ln
- 19474 Overland Park Dr
- 14404 Thatchers Ln Unit AL116
- 14423 Thatchers Ln Unit Y75
- 14423 Thatchers Ln Unit 76
- 14490 Fetterman Dr
- 19452 Overland Park Dr
- 14536 Fetterman Dr
- 14346 Thatchers Ln
- 14346 Thatchers Ln Unit 115
- 14327 Thatchers Ln Unit W68
- 14426 Thatchers Ln Unit AL117
- 14419 Settlers Way
- 14419 Settlers Way Unit 111