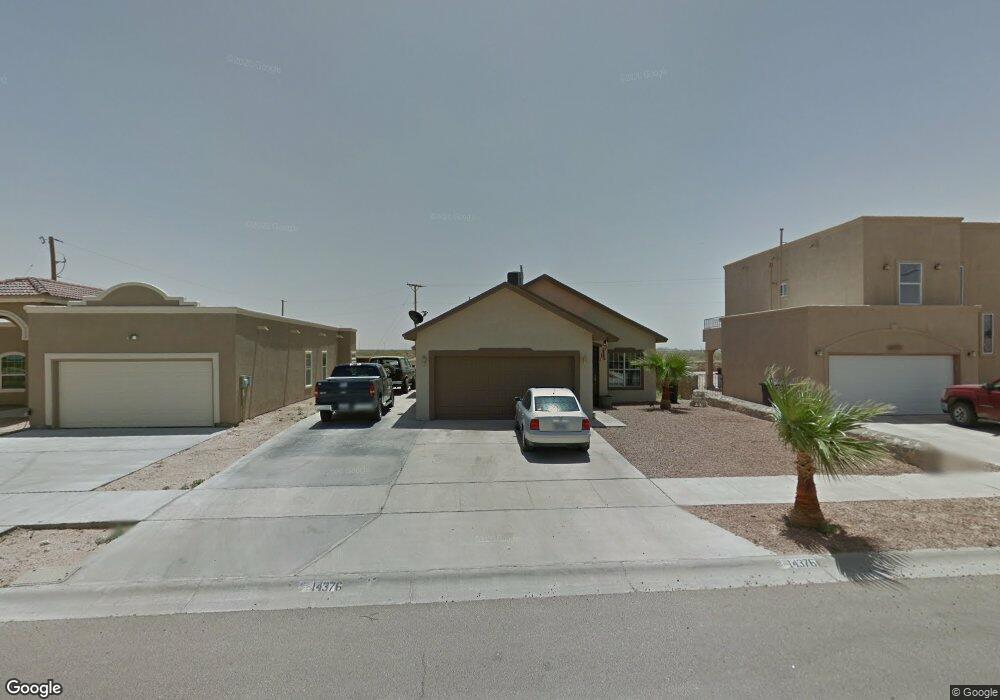
14376 Desert Wind Dr Horizon City, TX 79928
Estimated Value: $191,000 - $207,000
3
Beds
2
Baths
1,124
Sq Ft
$179/Sq Ft
Est. Value
About This Home
This home is located at 14376 Desert Wind Dr, Horizon City, TX 79928 and is currently estimated at $201,482, approximately $179 per square foot. 14376 Desert Wind Dr is a home located in El Paso County with nearby schools including Desert Hills Elementary School, Horizon Middle School, and Horizon High School.
Ownership History
Date
Name
Owned For
Owner Type
Purchase Details
Closed on
Jun 17, 2020
Sold by
Pineda Jose S
Bought by
Pineda Jose S and Pineda Mirna C
Current Estimated Value
Home Financials for this Owner
Home Financials are based on the most recent Mortgage that was taken out on this home.
Original Mortgage
$68,450
Outstanding Balance
$47,769
Interest Rate
3.2%
Mortgage Type
New Conventional
Estimated Equity
$153,713
Purchase Details
Closed on
May 5, 2005
Sold by
S & S Development Co
Bought by
Pineda Jose S
Home Financials for this Owner
Home Financials are based on the most recent Mortgage that was taken out on this home.
Original Mortgage
$75,600
Interest Rate
6.03%
Mortgage Type
Fannie Mae Freddie Mac
Purchase Details
Closed on
Dec 2, 2003
Sold by
Luxor Homes & Development
Bought by
S&S Development Co
Create a Home Valuation Report for This Property
The Home Valuation Report is an in-depth analysis detailing your home's value as well as a comparison with similar homes in the area
Home Values in the Area
Average Home Value in this Area
Purchase History
| Date | Buyer | Sale Price | Title Company |
|---|---|---|---|
| Pineda Jose S | -- | None Available | |
| Pineda Jose S | -- | -- | |
| S&S Development Co | $51,882 | -- |
Source: Public Records
Mortgage History
| Date | Status | Borrower | Loan Amount |
|---|---|---|---|
| Open | Pineda Jose S | $68,450 | |
| Closed | Pineda Jose S | $75,600 |
Source: Public Records
Tax History Compared to Growth
Tax History
| Year | Tax Paid | Tax Assessment Tax Assessment Total Assessment is a certain percentage of the fair market value that is determined by local assessors to be the total taxable value of land and additions on the property. | Land | Improvement |
|---|---|---|---|---|
| 2025 | $4,173 | $181,228 | $19,970 | $161,258 |
| 2024 | $4,173 | $165,985 | -- | -- |
| 2023 | $4,173 | $150,895 | $0 | $0 |
| 2022 | $4,448 | $137,177 | $0 | $0 |
| 2021 | $4,450 | $132,372 | $19,970 | $112,402 |
| 2020 | $3,938 | $113,369 | $19,970 | $93,399 |
| 2018 | $3,811 | $113,544 | $19,970 | $93,574 |
| 2017 | $3,473 | $104,586 | $19,970 | $84,616 |
| 2016 | $3,473 | $104,586 | $19,970 | $84,616 |
| 2015 | $3,264 | $104,586 | $19,970 | $84,616 |
| 2014 | $3,264 | $110,364 | $19,970 | $90,394 |
Source: Public Records
Map
Nearby Homes
- 14369 Desert Wind Dr
- 14277 Desert Ash Dr
- 760 Desert Ash Dr
- 761 Desert Star Dr
- 757 Desert Star Dr
- PN- 128111 Andover St
- 14204 Desert Sage Dr
- 479 N Kenazo Ave
- 14395 Desert Sage Dr
- 14370 Desert Sage Dr
- 14237 Desert Stone Dr
- 487 N Kenazo Ave
- 753 Desert Silver Dr
- .56 ACRES Argyle Ave
- 14240 Desert Mesquite Dr
- 469 N Kenazo Ave
- 721 Paseo Astuto Place
- 729 Paseo Astuto Place
- 712 Paseo Astuto Place
- 713 Paseo Del Agua St
- 14372 Desert Wind Dr
- 14380 Desert Wind Dr
- 14368 Desert Wind Dr
- 14364 Desert Wind Dr
- 14373 Desert Wind Dr
- 14365 Desert Wind Dr
- 14365 Desert Wind Dr Unit 1
- 14360 Desert Wind Dr
- 14361 Desert Wind Dr
- 14361 Desert Wind Dr Unit 1
- 14356 Desert Wind Dr
- 14357 Desert Wind Dr
- 14357 Desert Wind Dr Unit 1
- 14360 Desert Shadow Dr
- 14364 Desert Shadow Dr
- 14352 Desert Wind Dr
- 14353 Desert Wind Dr
- 14356 Desert Shadow Dr
- 14348 Desert Wind Dr
- 14349 Desert Wind Dr